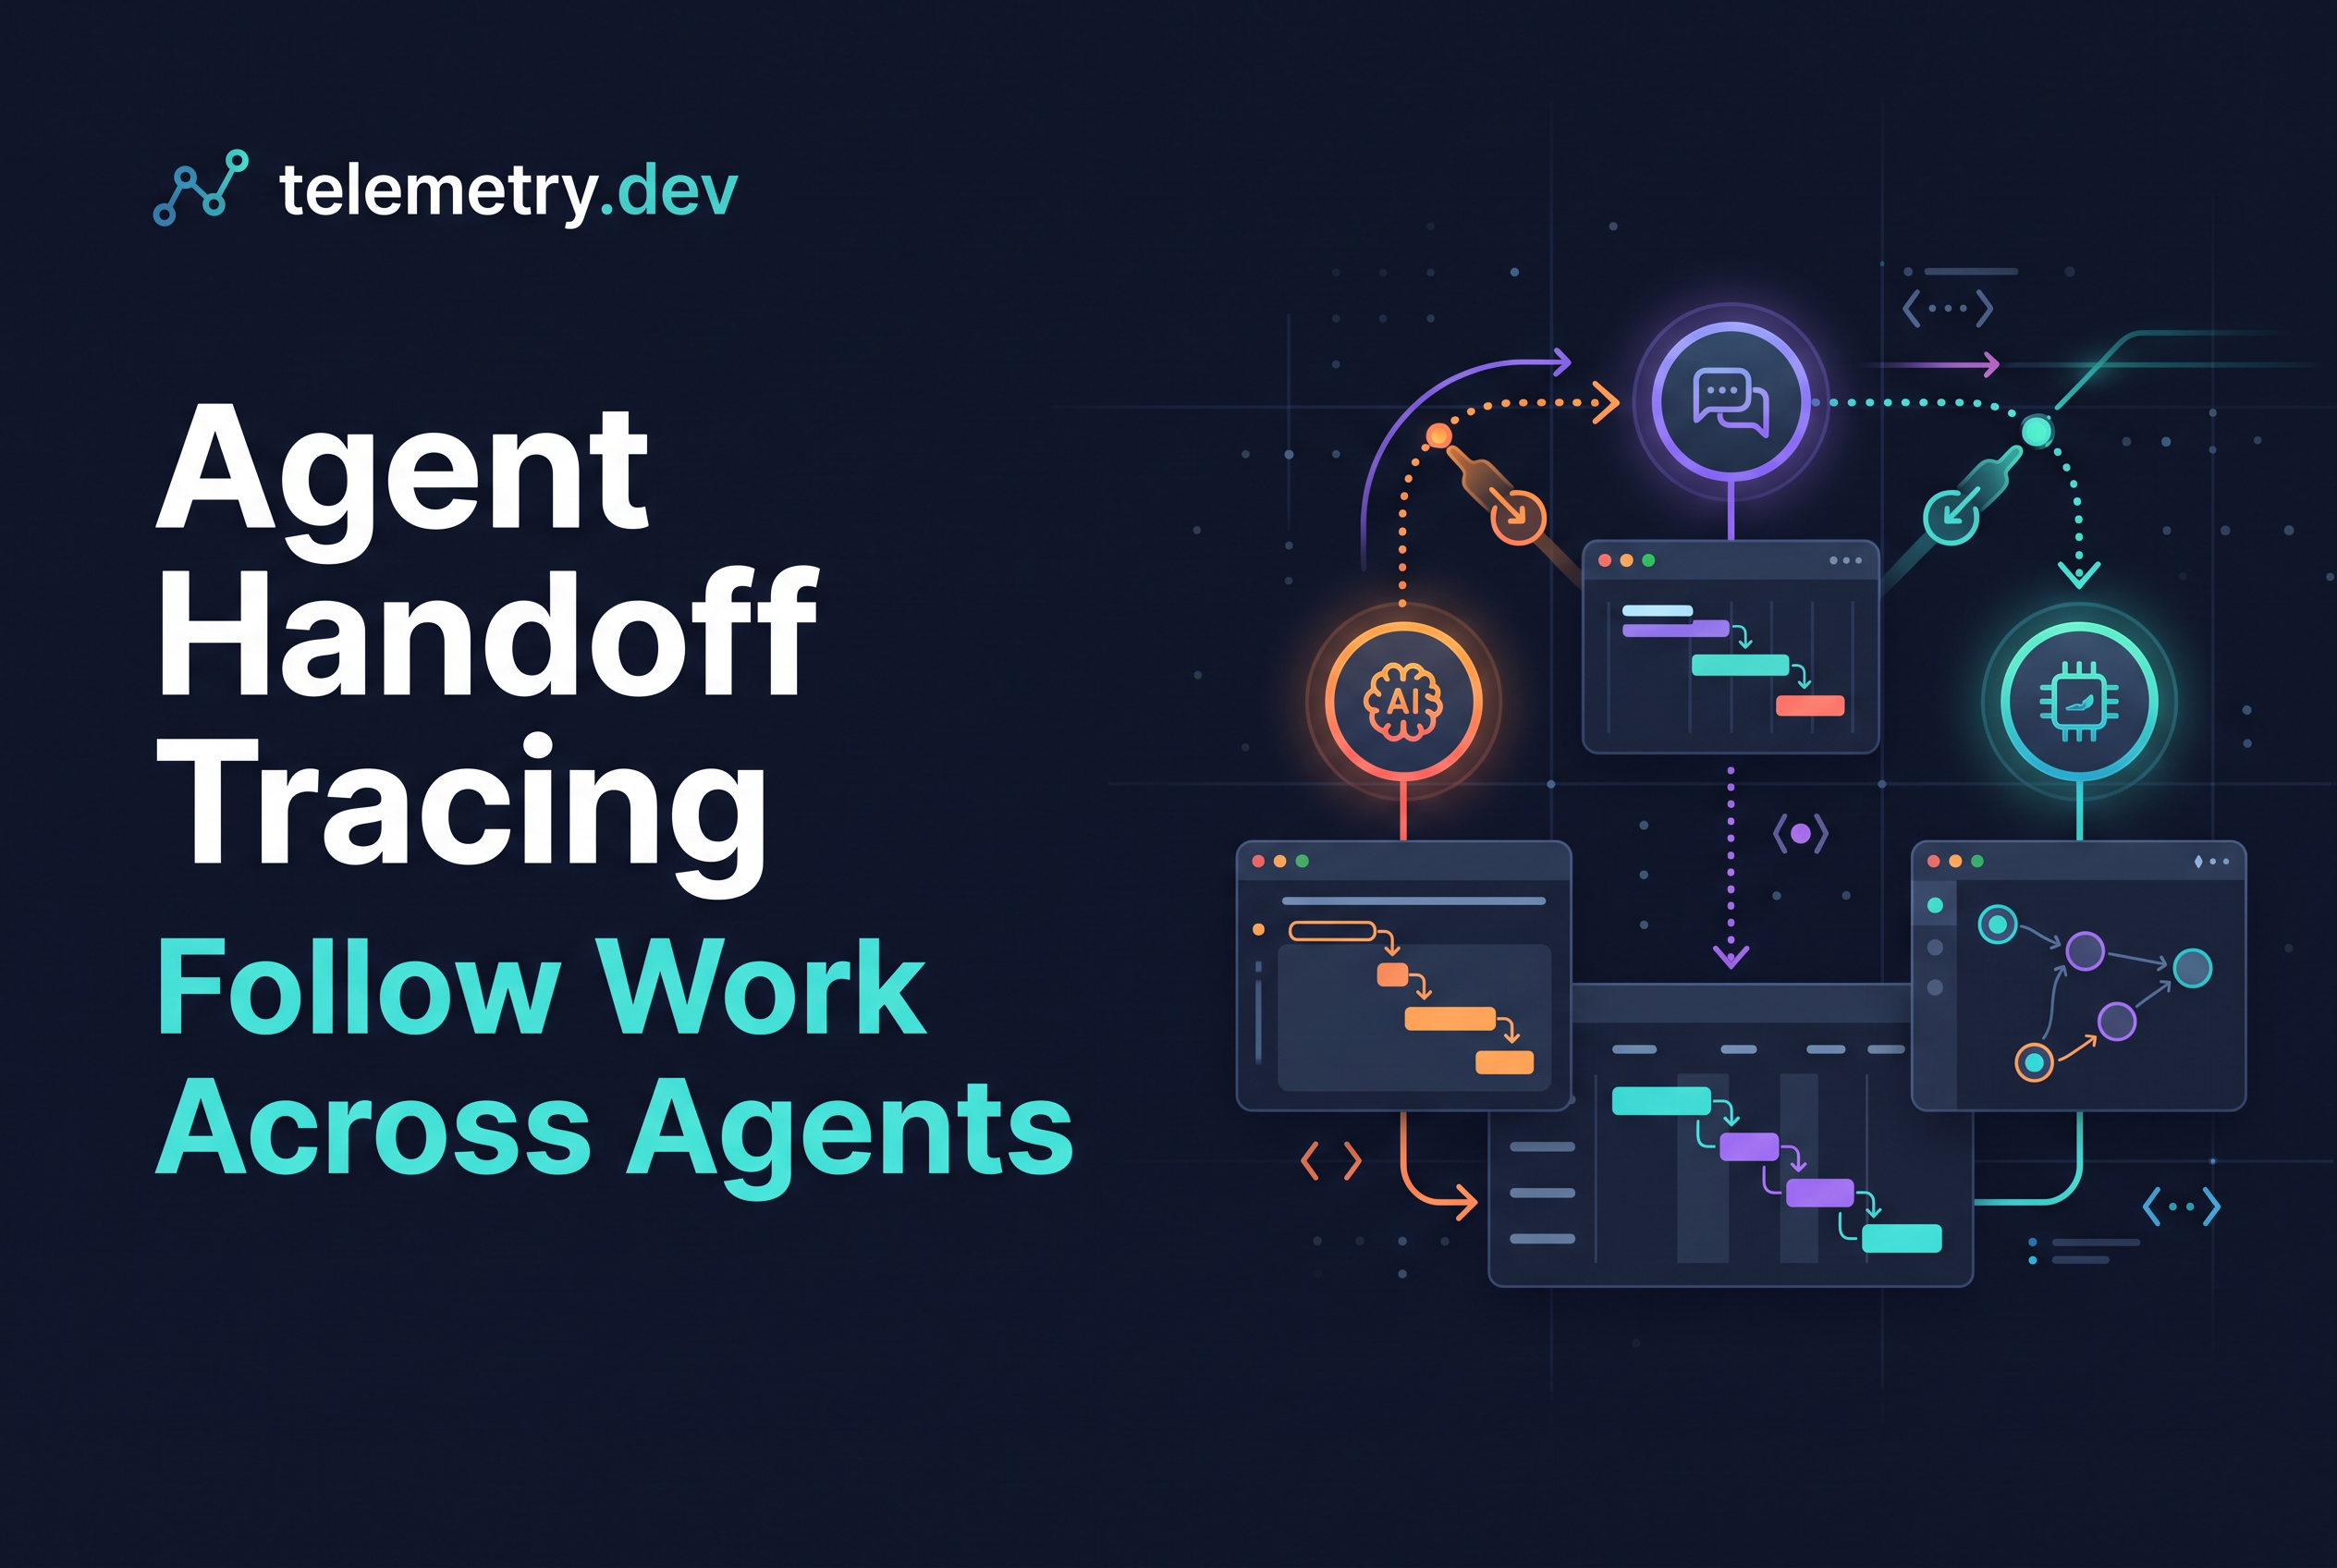
Agent handoff tracing means recording, with ordinary OpenTelemetry spans, the moment one agent delegates work to another, so you can see who handed off, who received it, and whether the receiver ever started. Inside one process the handoff is a parent-child span. Across processes it is propagated context plus either a parent-child relationship or a span link. In both cases you add your own handoff ID and outcome attributes, because no instrumentation library can know what "handoff" means in your application.
That last point matters. Nothing here is automatic. The OpenTelemetry GenAI conventions describe an invoke_agent operation, but they are still in Development status and have moved, so treat attribute names as subject to change. What follows is plain application instrumentation you can run today in TypeScript or Python and send to any OTLP/HTTP backend, including telemetry.dev, which traces model calls, tool steps and retrievals and tracks cost, latency, tokens and errors for AI apps and agents.
What counts as an agent handoff (and what other tracing guides already cover)
A handoff is a delegation: agent A decides that agent B should do a unit of work, and A either waits for the result or moves on. The interesting failures all happen at the seam. B never started. B started under the wrong run. Two agents both think they own the outcome.
This guide stays on that seam. It does not re-teach queue mechanics, because Generative AI Monitoring: Trace Queued Agent Jobs already covers injecting and extracting context across a message. It does not cover async span plumbing either; see LLM Tracing: Fix Async Parent and Child Span Links. Parallel fan-out lives in Parallel Tool Calls: Trace Slow Agent Fan-Out, and approval waits in Human-in-the-Loop Tracing: Separate Wait From Work.
Here the question is narrower. Given a delegation, what do you record so the trace answers "where did the work go?"
Same process: model the handoff as a parent-child span
When both agents run in one process, make the receiving agent's span a child of the delegating span. Context is already in memory, so you don't need propagation, and the trace tree shows the delegation directly.
The pattern is one span for the handoff itself, with the receiver's work nested under it. The OpenTelemetry GenAI agent conventions suggest an invoke_agent operation, using an INTERNAL span for in-process agent entrypoints and a CLIENT span for remote calls. Those conventions are in Development status, so pin your instrumentation version and expect renames.
A Python sketch:
with tracer.start_as_current_span("handoff") as span:
    span.set_attribute("app.handoff.id", handoff_id)
    span.set_attribute("app.handoff.target", "billing_agent")
    result = billing_agent.run(task)  # its spans become children
    span.set_attribute("app.handoff.outcome", "completed")
Keep the handoff span short and let the receiver's own spans carry the detail. If the handoff span is long and empty, you are measuring a wait, not work.
Across processes: propagate context, then choose parent-child or a span link
Across a process boundary, nothing carries trace context unless your code does. Propagation is the mechanism that moves context between services. Inject it into the request, message or job payload on the delegating side, and extract it on the receiving side.
Then make a choice, and make it on purpose:
Parent-child when one handoff maps to one receiver and you want the receiver's work inside the delegating trace. The messaging conventions allow this for single-message processing.
Span link when the receiver may start much later, process a batch, or be retried. A span has one parent but can carry many links, so a link records the causal relationship without merging traces. Current messaging conventions lean toward links for the general case.
My default for delegated agents: link when there is a queue or retry in between, parent-child when it is a direct call you await. Either way, the handoff ID below is what lets you join the two sides when the link is missing.
Define your own handoff ID, target and outcome attributes
Define application attributes for the handoff, because standard conventions don't know your delegation model. Three are enough to start:
app.handoff.id: a unique ID generated once by the delegating agent and sent to the receiver.app.handoff.target: the logical name of the receiving agent or role.app.handoff.outcome: a small fixed set such asrequested,accepted,completed,failed,rejected.
Set the ID on both the delegating span and the receiver's root span. Now a single attribute filter finds both halves of the handoff, even if a dropped header or a sampled-out span breaks the trace tree.
Use your own prefix, not gen_ai.*, for these. The GenAI namespace is unstable and these fields are yours. Keep outcome a bounded enum so you can group by it. Free-text reasons belong in a span event or a separate attribute, not in the value you aggregate on.
Keep one root run owner so the trace has a single answer to 'whose run is this?'
A trace needs exactly one answer to "whose run is this?" Pick the agent that received the original user request and call it the root run owner. Record it once, as app.run.id and app.run.owner_agent, and copy the same values onto every agent span in the run.
Without this, delegation chains get ambiguous fast. Agent B delegates to C, C reports back to B, and a dashboard grouped by "agent" credits the run to whoever happened to emit the last span. Latency, cost and failure then land on the wrong owner.
The rule: handoffs add targets, never owners. When B hands off to C, C gets a new app.handoff.id and inherits the original app.run.id. The owner stays with the agent that took the request. If you carry the run ID across processes, send it in the same payload as the trace context, and attach it to every receiver span so it survives a broken parent link.
Detect a missing receiving span: the handoff that never started
A missing receiver is the failure that standard tracing hides best, because an absent span produces no error. The delegating agent logs "handoff requested" and the trace simply ends.
You can query for it with the attributes you defined. Find delegating spans where app.handoff.outcome is requested and no span exists carrying the same app.handoff.id with a receiver role. Give the delegating span a deadline. If no accepted signal arrives within your timeout, set the outcome to failed or timed_out and record an error status on the span. That turns silence into a visible, countable event. For how deadlines flow through tool calls, see Agent Tool Call Timeout: Trace Deadline Propagation.
Check three causes in order. Context never made it into the payload. The receiver crashed before its first span. The receiver's spans were sampled out; LLM Trace Sampling: Diagnose Missing Runs covers that one. Because the handoff ID travels in the payload, you can search for it even when the trace tree is incomplete.
What are best practices for monitoring agents in production?
Alert on the failures that hide in handoffs: a delegating span with no matching receiving span, rising step latency, error spikes per tool, and token or cost jumps per run. Give every run one root owner and a stable handoff ID so you can filter to the broken run quickly. Then debug by opening the trace, finding the slow or failed step, and inspecting that call. Keep sampling and retention in mind, since the free plan keeps 14 days of data.
Correlate handoffs without leaking prompts: privacy-safe identifiers
Correlate on identifiers, never on content. The handoff ID should be a random value with no meaning outside your system: a UUID or similar, not a hash of the task text, not a user email, not a slice of the prompt.
Two habits keep this safe. First, never put the delegated instruction into attributes you use for joining. A task description in app.handoff.target is a leak waiting to happen. Second, treat anything riding on the message as visible to whoever can read the queue or logs, and allowlist the keys you send. The queued-jobs guide linked above covers a metadata allowlist in detail.
Prompt capture is a separate decision. In telemetry.dev, prompt capture can be turned off per environment before storage, and redaction patterns apply, but they can't catch all sensitive data. Don't rely on redaction to rescue an attribute you should never have set. In the OpenTelemetry GenAI conventions, message content is opt-in, and that is a sound default to copy for your own handoff payloads.
What should I track for an agent: prompts, tool calls, errors, costs?
Track every model call, tool call and retrieval as a span with duration, status, errors, token counts and cost, plus a handoff ID tying delegated work to its parent run. Prompt and completion text is optional and sensitive, so prefer hashed or opaque identifiers and capture content only where you need it. Computed cost needs reported token usage and a matching model price, so treat it as an estimate, not a billing record. Redaction won't catch everything, so avoid emitting secrets at all.
Checklist, unstable GenAI conventions, and how telemetry.dev ingests the spans
Before you trust a handoff trace, check:
Same process: receiver spans are children of the handoff span.
Cross-process: context is injected and extracted, and you chose parent-child or a link deliberately.
Every handoff has
app.handoff.id,app.handoff.targetand a boundedapp.handoff.outcome, on both sides.One
app.run.idand oneapp.run.owner_agentper run, copied to all agent spans.A deadline converts a silent non-start into
failedortimed_out.Identifiers are random, and no prompt text is used for joining.
On conventions: the GenAI agent-span conventions are in Development status, and OTEL_SEMCONV_STABILITY_OPT_IN=gen_ai_latest_experimental opts instrumentations into the latest experimental names. Keep your handoff attributes in your own namespace so a convention change never breaks your queries.
telemetry.dev accepts these spans over standard OTLP/HTTP, either from its TypeScript and Python SDKs or from any OpenTelemetry exporter or Collector, so you need no special instrumentation to use it. Your handoff attributes arrive as ordinary span attributes you can filter on. Pricing is per workspace: Free is $0 with 30k units and 14-day retention, Pro is $25 per month with 500k units, and Team is $50 per month with 2M units.
How do agent monitoring tools compare?
Compare tools on four things: whether they accept standard OpenTelemetry (OTLP/HTTP) so you avoid lock-in, whether they show agent-level traces rather than only infrastructure metrics, how cost is computed, and how pricing scales. telemetry.dev accepts any OTLP/HTTP exporter and has TypeScript and Python SDKs, with setup guides for LangChain/LangGraph. Pricing is per workspace, not per seat. It is not a general APM replacement.
What does AI agent monitoring look like in 2026?
Agent monitoring now means tracing a whole run across model calls, tool steps, retrievals and handoffs between agents, not just logging single LLM requests. The practical baseline is OpenTelemetry spans with a shared trace ID, plus cost, latency, token and error metrics per step. GenAI semantic conventions are still unstable, so pin your attribute names and keep custom handoff attributes alongside them. Start with one trace per user request and make sure every delegated agent adds a child span or a linked span.
What is AI agent monitoring?
AI agent monitoring is recording what an agent did during a run so you can find slow or failing steps afterward. In practice that means traces made of spans for each model call, tool call and retrieval, with latency, token counts, errors and cost attached. Observability goes one step further: you can ask new questions of that data without adding code. For multi-agent work, the key addition is a span showing where one agent handed work to another.
Does telemetry.dev cover enterprise agent monitoring, evals and governance?
No. telemetry.dev is built for small teams and focuses on traces of model calls, tool steps and retrievals, with cost, latency, token and error tracking for agents. If you need procurement-grade controls or evals, look elsewhere. If you need span-level visibility into delegated agents on a small team, it fits.
Add a handoff ID to your next delegation and query for the silence
The handoff you can't see is the one that matters, and a random ID plus a bounded outcome is what makes it visible. Pick one delegation path in your agent system this week, add app.handoff.id, app.handoff.target and app.handoff.outcome to both sides, and write the query for handoffs that were requested but never accepted. Point your OTLP/HTTP exporter at telemetry.dev's free plan and run that query against real traffic.
Share this article