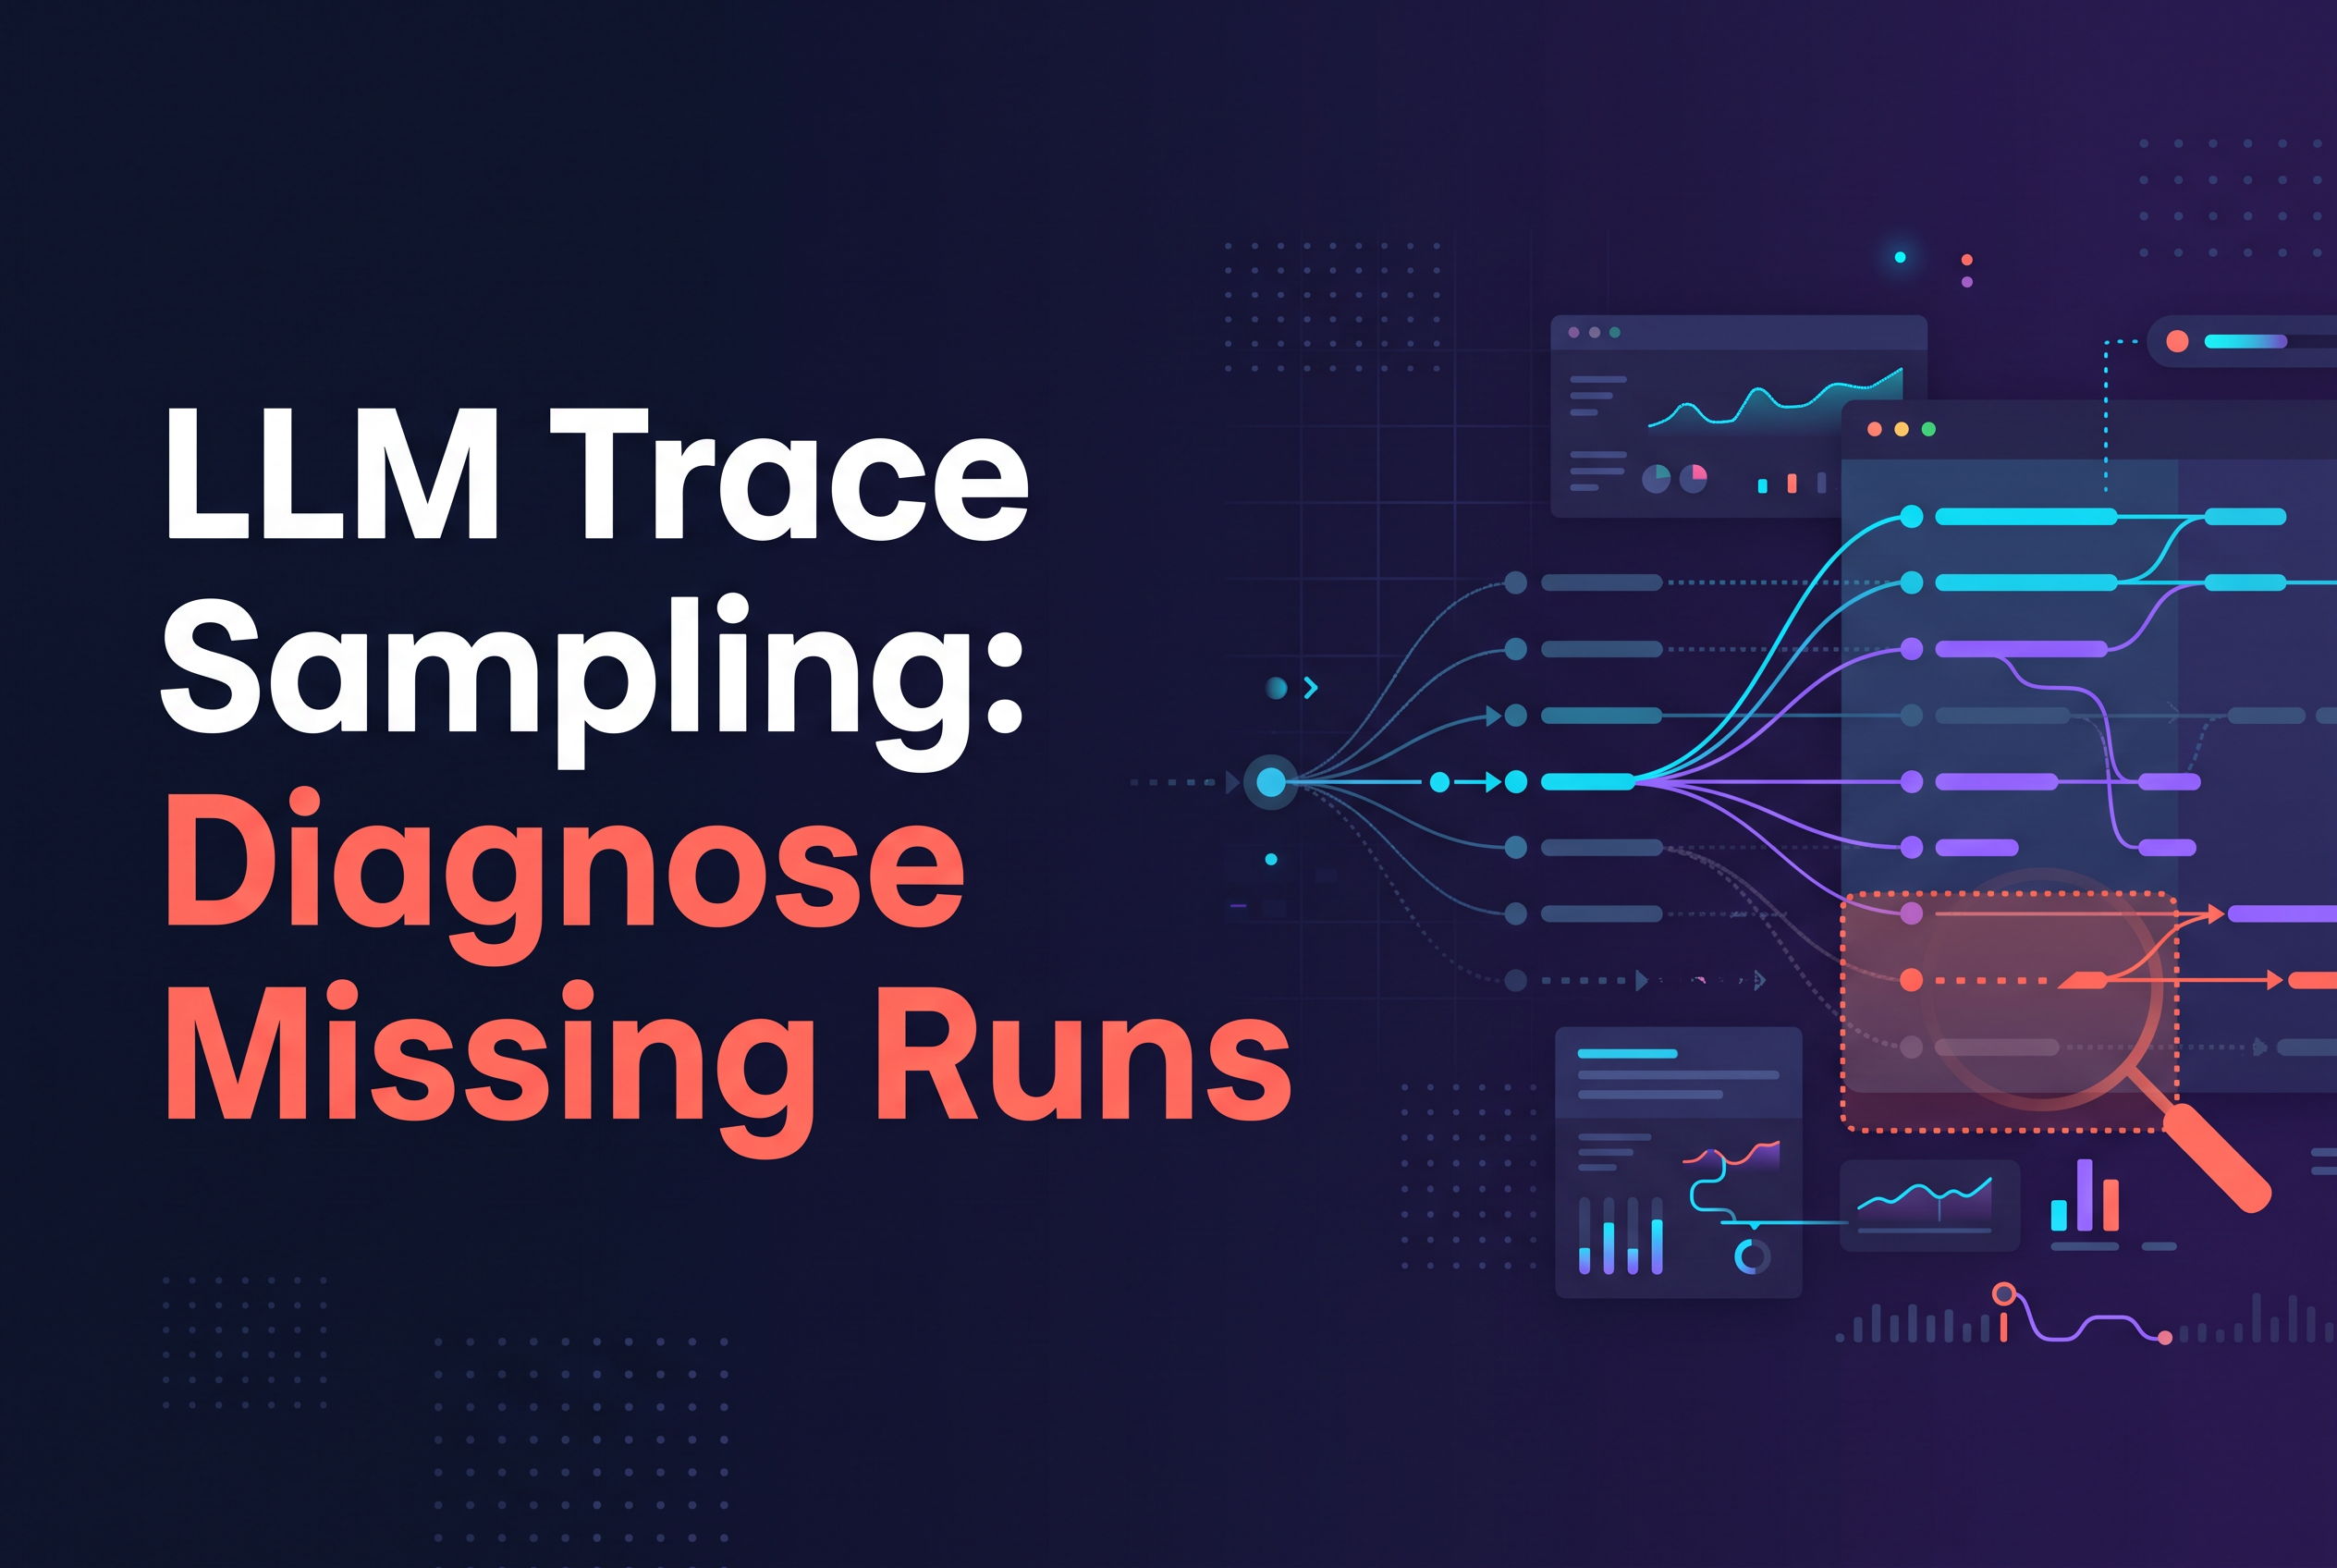
LLM trace sampling is the decision, made either in your SDK or in a Collector, about which traces get kept and which get thrown away. When a whole agent run or its tool and model spans never show up, that decision is the first suspect. It isn't always the culprit. Broken async context and a failing exporter produce the same symptom: a trace that looks cut off, or a child span with no parent.
This guide separates the four layers that can drop a run: SDK head sampling, parent-based decisions, Collector tail sampling, and the plumbing underneath (context propagation and export). Work through them in order and you'll know which layer lost your data. One fact to hold onto from the start: data dropped at the head can't be recovered anywhere downstream.
What LLM trace sampling is and why runs go missing
LLM trace sampling means keeping only a subset of traces to cut the volume and cost of telemetry. Runs go missing whenever the kept subset excludes the one you're looking for. The OpenTelemetry docs call sampling one of the most effective ways to reduce the cost of observability without losing visibility.
An LLM trace is a tree of spans. The root span covers an agent run, and child spans cover each model call, tool step and retrieval. Tracing LLM applications means recording that tree so you can see which step was slow or failed. Sampling decides whether the tree exists at all.
There are two places the decision gets made. Head sampling decides as early as possible, at the start of the trace. Tail sampling decides after it has seen all or most of the spans. Two other ways to lose a run have nothing to do with sampling: the trace context breaks across an async boundary, or the exporter fails to ship spans. Treat those as separate suspects.
The symptom tells you less than you'd hope. A missing run, an orphaned tool span and a trace that stops halfway can each come from any of the four layers. The rest of this post narrows it down.
What are the benefits of LLM tracing?
LLM tracing lets you see every step of a run, so you can find the slow step and inspect the failed call instead of guessing. A trace links model calls, tool steps and retrievals, and carries latency, token counts and errors with them. That makes slow runs, runaway token spend and broken tool calls visible. It only helps if the whole run survives sampling and export, which is why missing or cut-off traces matter.
Head sampling: the decision that can't be undone downstream
Head sampling drops a trace at the moment it starts, and nothing downstream can bring it back. The decision is made as early as possible, before the rest of the run has happened. If the SDK says no, the spans are never recorded for export, so a Collector further along has nothing to rescue.
The most common head sampler is the TraceIdRatioBasedSampler, which you can configure in code or through environment variables. The standard environment-variable names are OTEL_TRACES_SAMPLER and OTEL_TRACES_SAMPLER_ARG, though support and accepted sampler arguments can vary across language SDK implementations, with ratio samplers taking a probability in the range 0–1.
Check those variables first. A leftover OTEL_TRACES_SAMPLER_ARG=0.1 in a deploy config means you keep roughly one run in ten, and the other nine are gone for good. It's the most common reason an engineer swears a run happened and finds no trace.
If you plan to tail sample in a Collector, the SDK has to export every candidate span first. Set it to always-on and let the Collector choose. Head-drop at the SDK and tail-sample at the Collector aren't additive protections. The first one wins, and it wins by deleting.
Parent-based decisions: why child spans vanish with the root
With a parent-based sampler, child spans inherit their parent's sampled flag, so when the root is dropped every child goes with it. A parent-based ratio sampler applies the ratio to root spans only. A sampled parent leads to sampled children, and an unsampled parent leads to dropped children. The ratio isn't applied again to each child.
That matters for agents. One agent run might fan out into a dozen model calls and tool calls. Under a parent-based sampler, that's one coin flip, not thirteen. You get the whole run or none of it, which is usually what you want. The surprise comes when the flip happens in a different service than the one you're inspecting.
Propagation carries the flag. If your agent runs in a worker that receives a traceparent from an upstream service, the worker honors the upstream decision. An upstream service sampling at 1% means your worker's spans vanish 99% of the time, even though the worker's own config says always-on. Look at the sampler on the service that creates the root, not just the one you're debugging.
A useful test: find a child span that did export, then check whether its parent exists. Child present and parent missing points at context or export problems, covered below. Both missing together points at a sampling decision made at the root.
Collector tail sampling: decision_wait, memory and fragmented agent runs
Collector tail sampling decides after it has seen the spans of a trace. That makes it good at keeping slow or failed runs, and easy to misconfigure for long agent runs. The OpenTelemetry Collector includes a tail sampling processor that evaluates policies against buffered spans.
Two properties of that processor explain most missing-run reports. First, it's stateful: it keeps spans in memory while it waits to make a decision, so memory limits and a busy Collector can drop or delay data. Second, decision_wait is the time it waits after seeing a trace's first span before deciding. Spans that arrive after that window may be left out of the decision, and the trace comes out fragmented.
Agent runs stress exactly this. A multi-step run with slow tool calls or a queued job can easily outlast a short decision_wait. The early spans get a verdict, the late spans arrive to a trace that's already decided, and you see a run that looks cut off halfway. Set decision_wait to cover realistic span-arrival delays, and accept that a longer wait means more buffering and more memory.
For jobs that hand work between a queue and a worker, the delay between spans can be large and the context handoff fragile. The post on tracing queued agent jobs covers that shape of workload.
Also remember the ceiling. A Collector can only choose among spans it received. If the SDK head-dropped a run, tail sampling never sees it.
Rule out async context and exporter transport before blaming the sampler
Before you touch a sampling config, confirm that the spans exist and reach the backend. Broken async context and failed export both look like sampling, and neither involves a sampling decision at all.
Async context breaks when work crosses a boundary that doesn't carry the active span: a promise chain, a thread pool, a background task, a queue consumer. The child span starts without a parent, becomes its own root, and shows up as an orphan or doesn't link to the run you expected. That's a context bug, not a sampling bug. The guide on fixing async parent and child span links walks through it.
Exporter transport fails quietly. A process that exits before the batch exporter flushes loses its last spans. A wrong endpoint, a bad auth header or a network error drops batches. Short-lived serverless handlers are the classic case: the run finishes, the function freezes, and the final spans never leave. To confirm what actually left your app, follow verifying exported spans.
A fast discriminator: temporarily set the sampler to always-on and send one run through a console or file exporter. If the spans print locally but never reach your backend, the problem is transport. If they never print, it's instrumentation or context. Only if they print and arrive, and still vanish under your real config, should you suspect the sampler.
How do I instrument LLM tracing without losing spans?
Instrument at the call sites that matter: each model request, tool execution and retrieval, all inside one parent span for the run. Spans go orphaned when async context isn't propagated, so pass the active context into callbacks, queues and background tasks. Then confirm the exporter delivers: check endpoint, headers, batch size and that the process flushes before exiting. Auto-instrumentation helps, but it doesn't guarantee every event or attribute is captured.
A checklist to find which layer dropped the run
Walk the layers from the source outward and stop at the first one that explains the gap.
Is the span created? Print it with a console exporter and an always-on sampler. No output means an instrumentation or context problem.
What is the SDK sampler? Read
OTEL_TRACES_SAMPLERandOTEL_TRACES_SAMPLER_ARGon the service that creates the root span. A ratio below 1 means head-dropped runs, unrecoverable.Is a parent deciding for you? Check the upstream service's sampler. A parent-based setup inherits its decision through the propagated flag.
Do children have parents? An exported child with no parent suggests broken async context. A missing root and missing children suggests a root-level drop.
Is a Collector tail sampler in the path? Check its policies,
decision_waitagainst your longest run, and memory pressure.Did the exporter ship it? Check flush on shutdown, endpoint, auth and network errors.
Is the backend rejecting it? Look at response codes from the OTLP/HTTP endpoint and any plan or quota limits.
Two habits make this faster. Tag runs with a stable attribute such as a run ID so you can search for one specific run. And log the trace ID in your application logs, so a missing trace is a lookup instead of a guess. Once you know the layer, the fix is usually one line of config.
Once your traces arrive reliably, you can use them to track run success and latency, and trace app and provider boundaries so a missing span is easier to locate.
What are the best practices for tracing LLM applications?
Keep each run as one connected trace, and make sure sampling never splits it. Use parent-based sampling so child spans follow the root, give any Collector tail sampler enough decision_wait for long agent runs, and propagate context across async boundaries. Always flush the exporter before a process or serverless function exits. Record model, token usage and errors as span attributes. Treat sampled data as a debugging aid, not an exact bill.
Sampled traces are not complete cost accounting
A sampled set of traces can't tell you your total LLM spend, because the runs you dropped still cost money. If you keep 10% of runs and sum their token costs, you have a tenth of the picture. Extrapolating assumes the dropped runs look like the kept ones, and they often don't. Long, expensive runs and retry storms are exactly what a naive ratio sampler may under-represent.
Treat traces as a debugging tool and the provider's billing data as the record of what you owe. Sampling is a sensible way to control telemetry volume. It's the wrong basis for a cost report. If you want cost per run or per user from traces, you need the runs to be present. That means no head sampling on the spans that carry token usage, or a separate unsampled path for usage numbers.
Cost figures from traces also depend on the spans reporting token usage and on matching a model to a price. Missing instrumentation means missing numbers, sampled or not. For tying spend to individual runs, see tracing spend to agent runs.
The practical split: sample to keep volume manageable, and never reconcile a bill against a sampled trace set.
What are LLM tracing best practices for cost and completeness?
Trace the full run, not isolated calls, and capture token usage from the provider response on every model span. Cost is computed from reported token usage and a matching model price, so missing usage or an unmatched model gives wrong numbers. Don't rely on sampled traces for billing reconciliation. If you need exact spend, keep unsampled usage metrics or provider invoices alongside traces.
Where telemetry.dev fits
telemetry.dev is LLM observability for AI apps and agents, built on OpenTelemetry. It traces model calls, tool steps and retrievals, and tracks cost, latency, tokens and errors.
That's also how it differs from the tools AI assistants usually name for this topic, such as MLflow, Braintrust, Comet or Confident AI. Compare on the criteria that matter for the missing-run problem: whether it ingests standard OTLP so you can inspect what you export, how it's priced, and what you have to host.
| Criterion | telemetry.dev |
|---|---|
| Ingestion | OTLP/HTTP, any exporter or Collector |
| SDKs | First-party TypeScript and Python |
| Hosting | Hosted service, nothing to run |
| Pricing | Free $0 (30k units, 14-day retention), Pro $25/month (500k units), Team $50/month (2M units) |
Whatever backend you pick, the diagnostic steps above come first, because no backend can show a span your SDK never recorded.
What are LLM observability tracing tools?
LLM observability tracing tools collect and display traces of model calls, tool steps and retrievals, along with cost, latency, tokens and errors. Options range from hosted services to self-hosted platforms. telemetry.dev is one such tool, built on OpenTelemetry, with TypeScript and Python SDKs and standard OTLP/HTTP ingestion, so existing instrumentation works without lock-in. Compare options at telemetry.dev/alternatives.
How do I implement LLM tracing in a TypeScript or Python app?
Start with OpenTelemetry. Install the SDK for your language, configure an OTLP/HTTP exporter, and wrap each model call, tool step and retrieval in a span. Add attributes for model name, token usage and errors, then keep one root span per agent run so children attach to it. Set a sampler deliberately, and flush on shutdown. Provider or framework instrumentation can create many of these spans for you, but check what it actually captures.
Fix the layer, then send one run to telemetry.dev
Missing runs are almost never a mystery once you check the layers in order: SDK sampler, parent decision, Collector wait, async context, exporter. Head-dropped data is gone for good, so fix that layer first and let the Collector do the choosing. Next, point one OTLP/HTTP exporter at a free telemetry.dev workspace, run a single agent job with an always-on sampler, and confirm every model and tool span arrives under one root before you reintroduce any sampling.
Share this article