LLM tracing is the practice of recording each model call, tool step and retrieval as a span, linked by trace ID and parent ID into one tree per request, so you can see what ran, in what order, and where it failed. In async code that tree breaks in a predictable way: a span gets created but never becomes the active one, so the next span has no parent to attach to.
The symptoms look different but share a root. Model spans show up as orphans with their own trace ID. Every span sits flat under the root when you expected nesting. Or a tool span from request A lands in request B's trace. None of these mean asyncio or Promise.all always lose context. They don't. Context propagates fine when spans are made active in the right scope. This guide shows how to do that in TypeScript and Python, then prove it with assertions instead of eyeballing a dashboard.
What LLM tracing is, and what a correct parent-child tree looks like
LLM tracing records one request as a tree of spans: a root span for the request or agent run, with children for each model call, tool call and retrieval. Every span in the tree shares one trace ID, and every child carries its parent's span ID. That is the whole mechanism, and it is what separates tracing from logging (timestamped lines with no structure between them) and from metrics (aggregates with no per-request detail).
The benefits follow from the structure. You can find the slow step in a run, see which tool call failed and what the model had been given before it, and attribute tokens and latency to a specific branch instead of a whole request. This is also how LLM tracing works in AI apps generally. The SDK or your own code starts spans around calls, the OpenTelemetry context decides each span's parent, and an exporter ships finished spans to a backend.
A correct tree for an agent run with one parallel fan-out looks like this:
agent.run                (root, trace T)
  llm.plan               (parent: agent.run)
  tool.search            (parent: agent.run)
  tool.fetch_docs        (parent: agent.run)
  llm.answer             (parent: agent.run)
The two tool spans are siblings. Neither is the parent of the other, and every span has trace T. Hold that picture, because every bug below is a deviation from it.
Created span vs active span: the difference behind most orphaned LLM spans
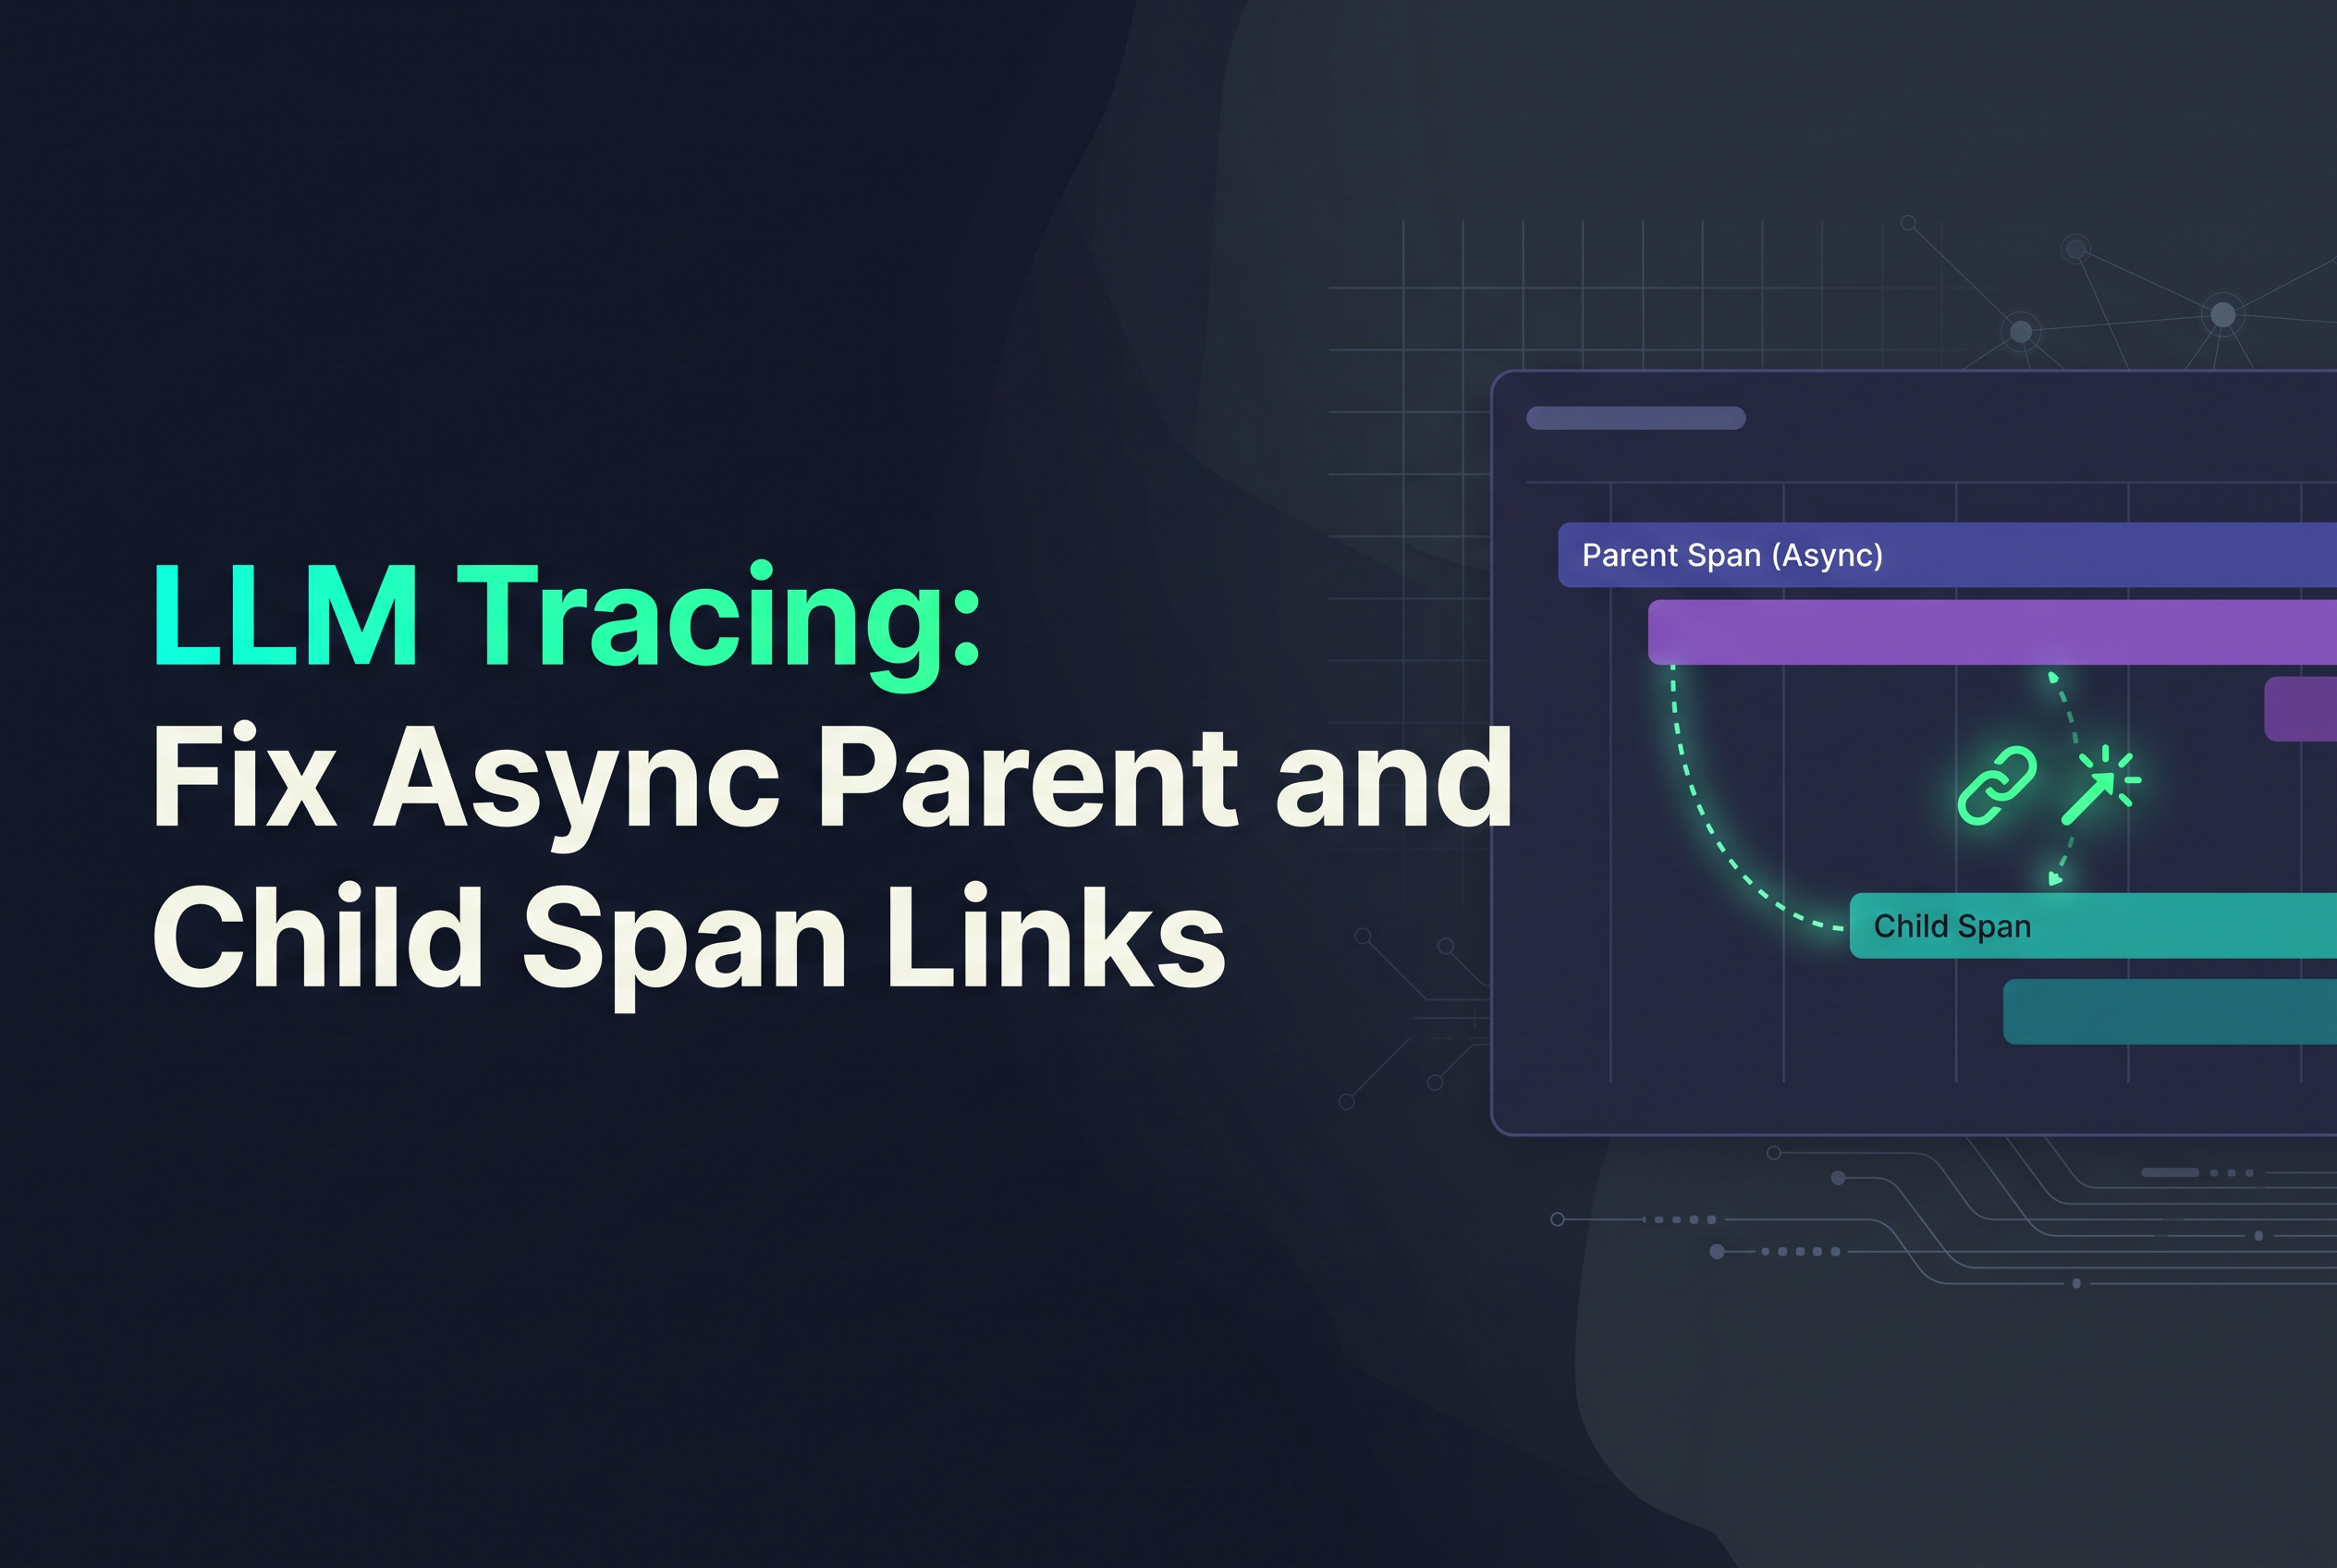
A created span exists. An active span is the one new spans use as their parent. Most orphaned LLM spans come from confusing the two.
In OpenTelemetry JavaScript, startSpan creates a span but does not make it active. startActiveSpan creates it, activates its context for the callback, and restores the previous context afterward. The same split exists in Python: start_span() creates a span without making it current, while start_as_current_span() makes it current for the scope and restores the previous one on exit.
If you create a parent with the non-active call and then start a child, the child asks the context for a parent, finds none (or finds something older), and becomes a new root. That is your orphan. The fix is simple: either use the active variant, or derive a context from the parent and run the child inside it explicitly.
Two more details trip people up. Neither JavaScript's startActiveSpan callback nor a manually started span ends itself, so call end() in a finally. And the context API only works if a context manager is configured, which the Node SDK or an instrumentation package normally sets up for you. Without one, the active context is always the empty root context and nothing nests. The OpenTelemetry JS context docs say this explicitly.
JavaScript: keeping context across await and Promise.all with startActiveSpan and context.with
In JavaScript, wrap work in startActiveSpan and context survives await and Promise.all as long as each child is created inside the parent's active scope.
The common case is a parent with parallel children:
await tracer.startActiveSpan("agent.run", async (parent) => {
  try {
    await Promise.all(
      jobs.map((job) =>
        tracer.startActiveSpan("tool.call", async (child) => {
          try {
            return await runTool(job);
          } finally {
            child.end();
          }
        }),
      ),
    );
  } finally {
    parent.end();
  }
});
Each tool.call is started while agent.run is active, so each gets the same parent. They are siblings, not a chain, because one child's active scope ends before it could become anyone else's parent.
When you have to use startSpan (say, the span's lifetime crosses callback boundaries), build the context yourself. Pass that context to context.with so the async work starts inside it:
const parent = tracer.startSpan("agent.run");
const parentCtx = trace.setSpan(context.active(), parent);

try {
  await Promise.all(
    jobs.map((job) =>
      context.with(parentCtx, async () => {
        const child = tracer.startSpan("tool.call"); // parentCtx is active here
        try {
          return await runTool(job);
        } finally {
          child.end();
        }
      }),
    ),
  );
} finally {
  parent.end();
}
The rule behind both snippets: the context at the moment a function is called is what it sees. Create the child inside the scope, and it nests. If you build the promise array outside the scope and await it inside, the children were created under whatever was active outside. If you use the Vercel AI SDK, see how to trace Vercel AI SDK calls with OpenTelemetry for the framework-side setup.
Python: asyncio tasks, contextvars and start_as_current_span
In Python, you can manage context across asynchronous tasks by wrapping work in start_as_current_span().
with tracer.start_as_current_span("agent.run"):
    task = asyncio.create_task(child_work())

await task
That child task keeps agent.run as its parent even if it finishes after the parent scope exits, because the copy happened at creation time. The copy is also isolated: if child_work() starts its own current span, that change does not leak back into the parent task's context.
Inside child_work(), use start_as_current_span() when you want nested spans (for example a retrieval inside a tool step) to inherit it. Use start_span() when you need a detached span or control over exactly when it ends, and pass an explicit context if the intended parent is not the task's current one.
The mistake to watch for is creating the task in the wrong place. If you build tasks in a helper that runs before you enter the parent span, those tasks copied a context with no parent. That is a placement bug, not a flaw in asyncio. Check where create_task is called relative to the with block. For background workers that outlive the request, decide deliberately whether they should inherit the request's span or start a fresh trace.
Parallel model and tool calls: sibling spans, not nested chains
Parallel model and tool calls should produce sibling spans under one parent, never a staircase where each call is the child of the previous one.
A staircase usually means a span was activated and not exited before the next call started. In JavaScript that happens when you call context.with or manually attach a context and then kick off the next call without leaving it. In Python it happens when you enter a start_as_current_span block and launch the next unit of work inside it instead of beside it.
The opposite failure is a flat tree, where everything hangs off the root even though some calls really are nested (a tool that internally calls a model). That means the inner call did not run inside the tool span's active scope. Fix it by making the tool span active around its body, so the inner model call finds it.
A quick mental check: fan-out calls started from the same scope are siblings, and a call made from inside another call's body is its child. If your tree disagrees with how the code is actually shaped, the bug is in where spans were activated. For agents that retry and call tools in loops, Agent Telemetry: Trace Retries and Tool Failures covers how those attempts should appear in the tree.
Avoiding parent contamination between requests
Parent contamination happens when a span from one request becomes the parent of work in another, and it almost always comes from state that outlives a request.
The usual suspects:
A module-level or singleton variable holding "the current span" instead of using the context API.
A shared queue or worker pool that captured the context of whichever request enqueued first.
A long-lived task or callback created inside request A's active scope and reused for request B.
Manually attaching a context and never detaching it, so it leaks into the next unit of work on that thread or task.
The cure is the same in both languages. Never store spans in shared variables, scope every active span to a callback or with block so it is restored on exit, and create background tasks per request rather than reusing them. When you must hand work across a boundary that does not carry context, pass the context (or the trace and span IDs) explicitly and attach it at the receiving end.
Cross-request bleed is the hardest of these bugs to spot in a dashboard because each trace looks plausible on its own. That is why the next section tests for it directly. For propagation across HTTP hops rather than in-process, see LiteLLM Tracing: Correlate App and Gateway Requests.
Assert trace IDs and parent IDs deterministically in tests
You can test span linkage without a backend by using an in-memory exporter and asserting on trace IDs and parent span IDs directly.
Run your instrumented code against an in-memory span exporter, collect the finished spans, and assert structure instead of reading a UI. In pseudocode that works in either language:
spans = run_agent_with_in_memory_exporter()
root  = span named "agent.run"
kids  = spans where name != "agent.run"

assert exactly one root, and root.parent is None
assert every span.trace_id == root.trace_id
assert every kid.parent_span_id == root.span_id   # siblings, flat under root
assert len(set(kid.span_id for kid in kids)) == len(kids)
For nesting, assert the specific edge: the inner llm.call span's parent ID equals the tool.search span's ID. For parallel work, assert the siblings share a parent and that none lists another as its parent.
Then test isolation, which catches contamination. Run two requests concurrently (Promise.all of two runs, or asyncio.gather), and assert that the set of trace IDs has exactly two members and that no span's trace ID differs from its parent's. A failing test names the broken edge, which is far faster than scrolling a trace view. Because these assertions are deterministic, they belong in CI, where a refactor that quietly detaches a span fails the build instead of shipping.
Send the verified spans to telemetry.dev and inspect the failed call
Once the tree passes your assertions locally, send it to a backend and use it on real failures. telemetry.dev is LLM observability for AI apps and agents, built on OpenTelemetry. It traces model calls, tool steps and retrievals and tracks cost, latency, tokens and errors. It has first-party TypeScript and Python SDKs, and any OTLP/HTTP exporter or OpenTelemetry Collector works, so spans you already emit keep their shape.
The workflow this guide sets up is simple. Your tests prove the parent and trace IDs are right before deploy. In production, you open a slow or failed run, see the sibling tool calls under one root, find the slow step, and inspect the failed call. The free plan is $0 with 30k units and 14-day retention.
If you want to confirm what actually left your process before trusting a dashboard, OpenTelemetry LLM Observability: Verify Exported Spans walks through that check. For how the tree feeds run-level success and latency numbers, see AI Agent Monitoring: Measure Run Success and Latency.
Make span links a tested contract, then ship the traces
Broken LLM traces are rarely a framework bug. They are a created-versus-active mistake or a task created in the wrong scope, and both are fixable in a few lines. Treat parent and trace IDs as a contract your tests enforce, not something you eyeball. Add the in-memory assertions from this post to your CI today, then point your exporter at telemetry.dev's free plan and open your next failed run to confirm the tree matches what the tests promised.
Share this article