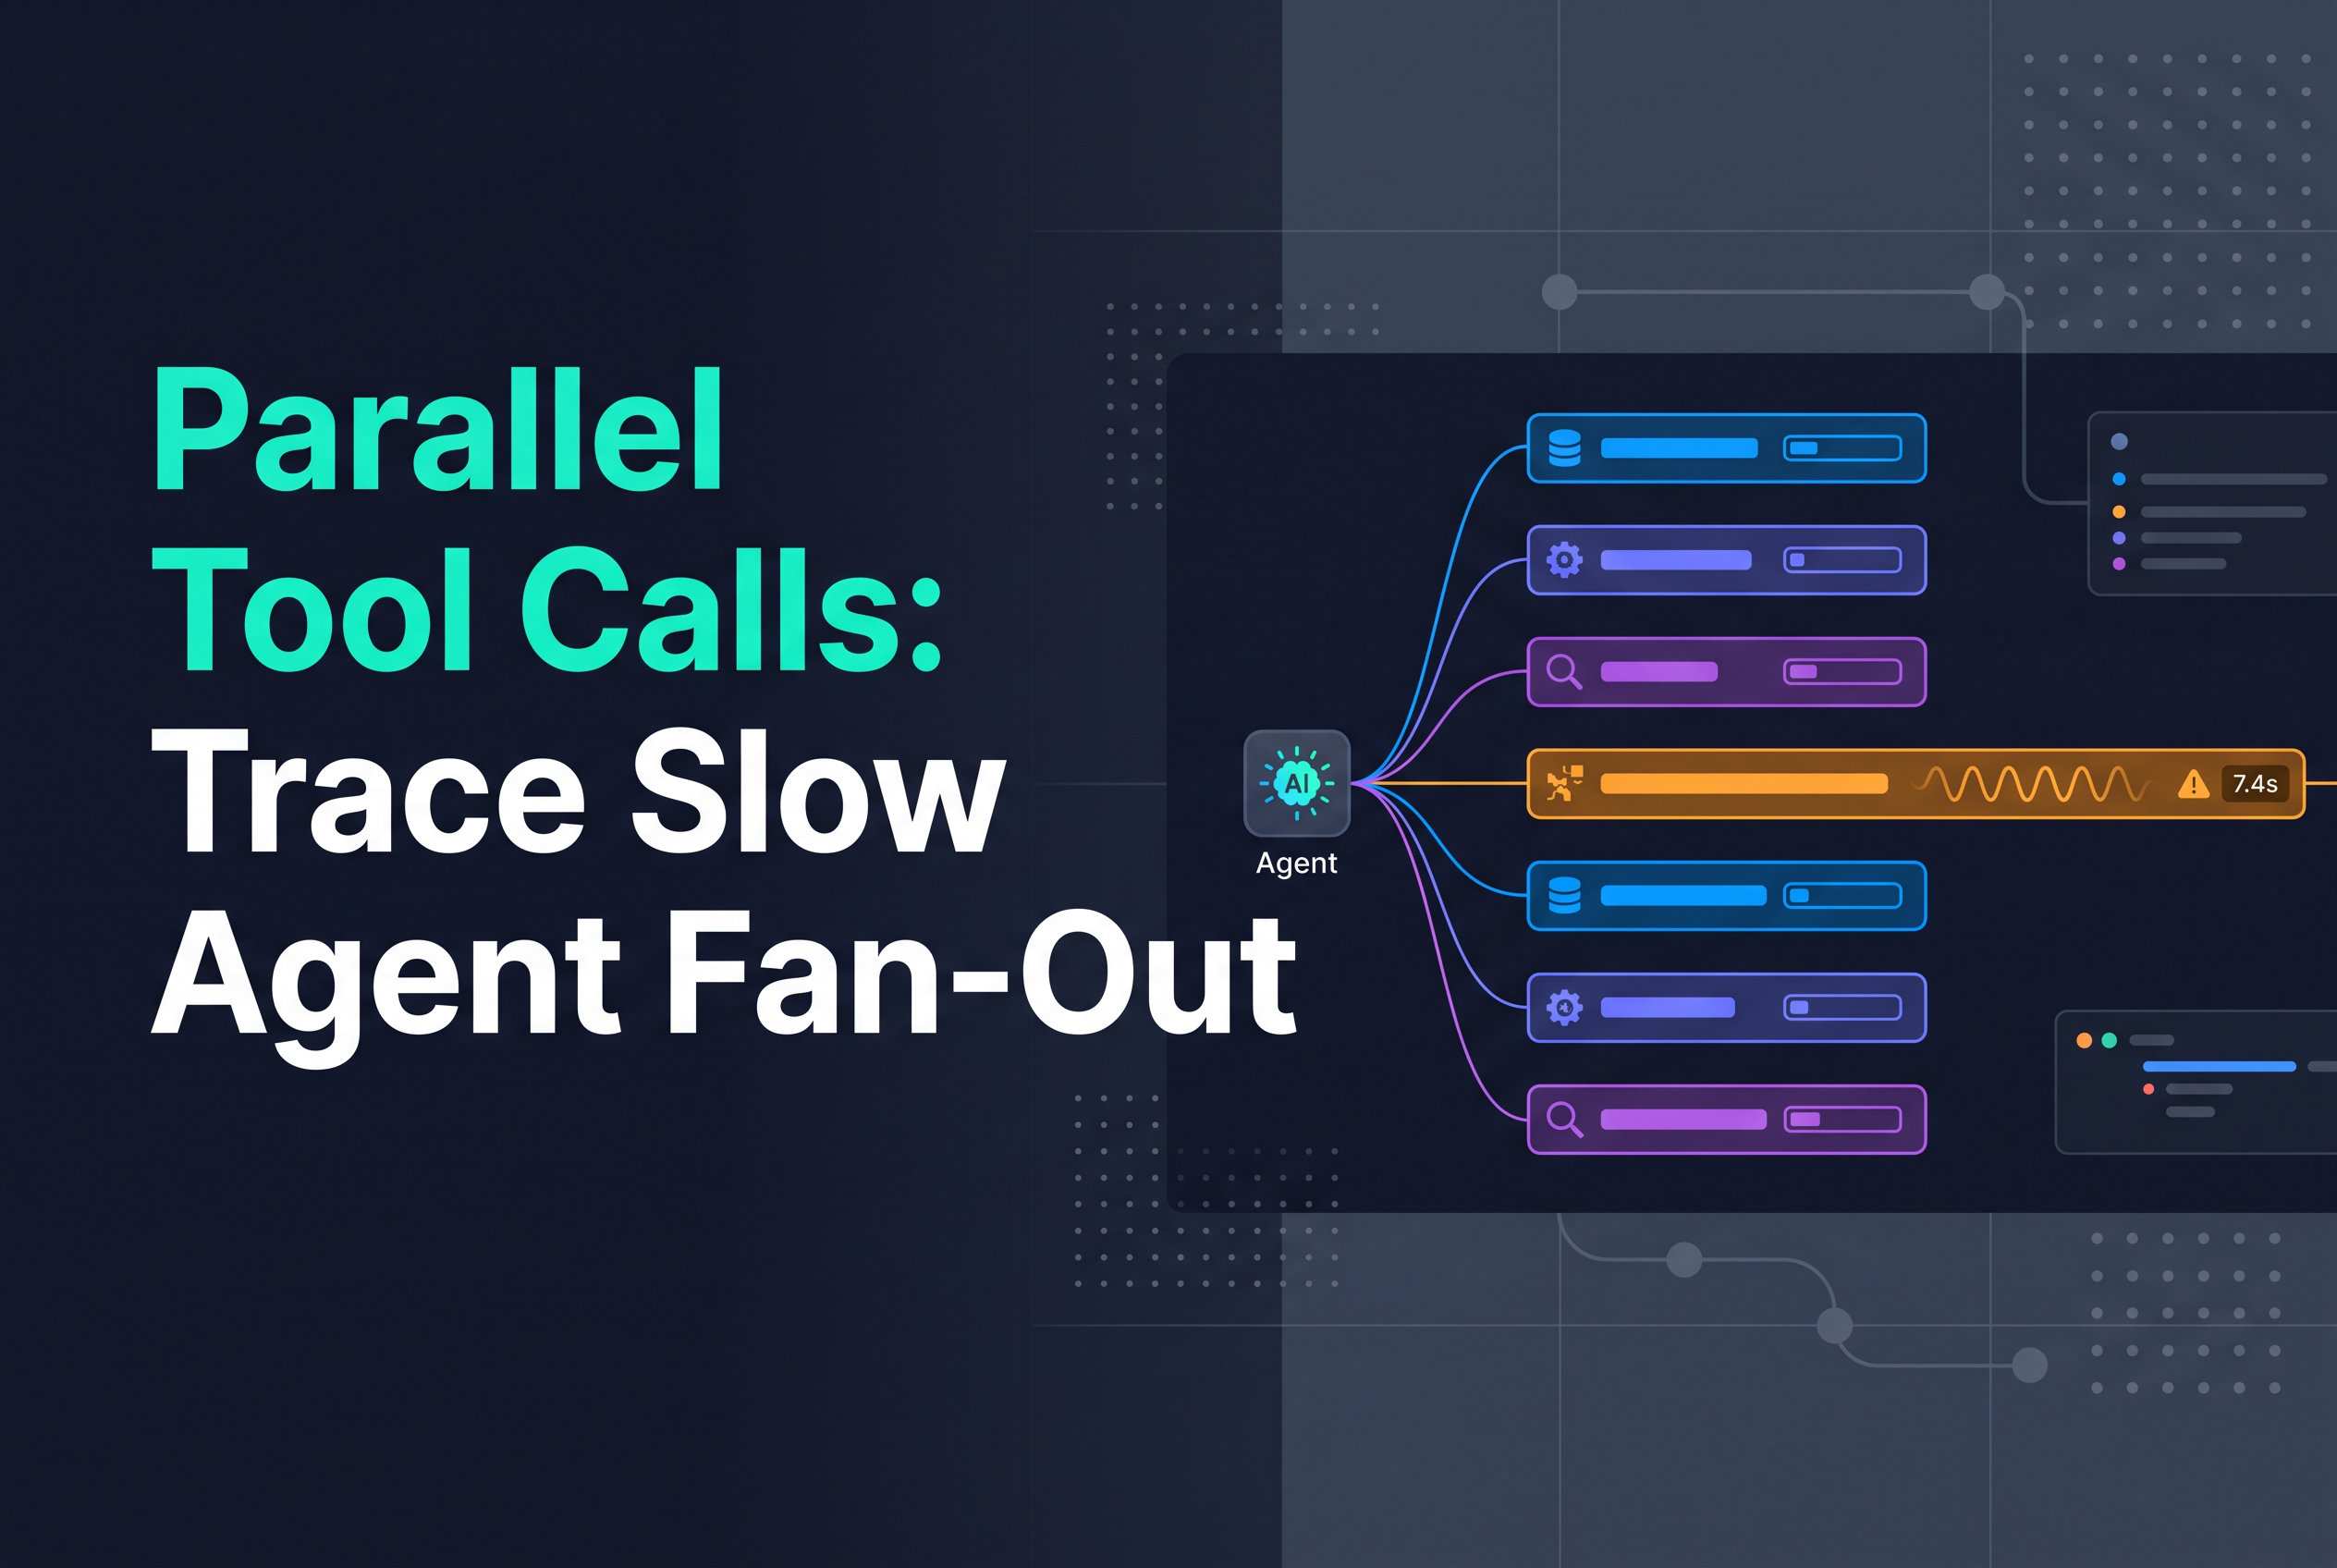
To trace parallel tool calls, write a fan-out parent span, one child span per branch and a join span yourself, then compare wall-clock time on the parent with the summed duration of the children. A flat list of spans can't tell you which branch held up the response, and neither can an average. The structure has to come from your instrumentation.
This matters because the model providers now hand you concurrency for free. OpenAI lets a model request several independent calls in one turn, and Anthropic's Claude can return several tool_use blocks in a single response. Your code runs them concurrently, collects the results and sends them back. Somewhere in that sequence, one branch was slow or failed, and the user waited on it.
telemetry.dev is LLM observability for AI apps and agents, built on OpenTelemetry. It shows the spans your app emits for model calls, tool steps and retrievals, with latency, tokens, cost and errors. What it shows depends on what you emit. This guide covers what to emit for a fan-out, and how to read it.
What parallel tool calls change about a trace
Parallel tool calls break the assumption that a run's duration is the sum of its steps. In a sequential agent, step durations add up to roughly the run time. With concurrent branches they overlap, so the sum of span durations can be two or three times the elapsed time the user felt.
The provider side is simple. For OpenAI Chat Completions, parallel tool calls may be enabled or disabled with parallel_tool_calls on supported models; when calls are returned, execute them and send one role: "tool" message per call, matching each tool_call_id. With Anthropic, you return one tool_result per tool_use block, all inside a single next user message. In both cases the provider only sees the final bundle. It has no idea which branch you waited on.
That is why the trace has to carry the structure. The model call that requested the tools is one span. What happens between that response and the next model call is your code's work, and nothing records it unless you do.
Model the fan-out: one parent span, one child per branch
Create one parent span for the whole fan-out, and one child span per tool call, each started inside the parent's context. Name the parent for what it is (for example tools.fan_out) and each child for its tool. Put the provider's call ID on every child as an attribute, so a branch maps back to the tool_call_id or tool_use block it answered.
In TypeScript the shape is:
await tracer.startActiveSpan("tools.fan_out", async (parent) => {
  parent.setAttribute("fanout.branch_count", calls.length);
  const results = await Promise.allSettled(
    calls.map((call) =>
      tracer.startActiveSpan(`tool.${call.name}`, async (span) => {
        span.setAttribute("tool.call_id", call.id);
        try { return await run(call); } finally { span.end(); }
      })
    )
  );
  parent.end();
});
In Python the equivalent is asyncio.gather(..., return_exceptions=True) with each coroutine opening its own span under the parent. The point in both is the same: children are created inside the parent's active context, so they attach to it even though they run at once.
Watch async context. If a branch runs in a worker or a task that doesn't inherit context, its span becomes an orphan root. The fix is covered in Fix Async Parent and Child Span Links.
Wall-clock time vs summed span duration: reading overlapping branches
Read the fan-out parent's duration as wall-clock time and the sum of the children as total work. They answer different questions, and mixing them up sends you after the wrong fix.
Take a fan-out with four branches that take 0.4s, 0.5s, 0.6s and 3.1s. The parent lasts about 3.1s. The summed child duration is 4.6s. If you read the sum, you'd conclude the tools cost 4.6 seconds of user-visible latency and look for broad savings. If you read the parent, you see 3.1s, and one branch accounts for almost all of it. Making the three fast tools twice as fast saves nothing the user can feel.
So compare three numbers per fan-out: the parent's elapsed time, the longest child, and the sum of the children. When the parent is close to the longest child, one branch is the bottleneck. When the parent is much longer than the longest child, time is going somewhere else, usually the join, covered below.
Be precise about what you can claim. Your spans give you start times and durations, so you can see which child ended last and how branches overlap on the timeline. That is your reading of the data, not an automatic critical-path result. If the longest branch ends just before the parent does, say so from the timestamps.
For the run-level view that sits above this, see AI Agent Monitoring: Measure Run Success and Latency.
Failed and cancelled branches: record the outcome of every branch
Record an outcome on every child span, not just the ones that throw. A parallel run can fail partly: three branches return, one errors, and the model still answers from incomplete evidence. If only the error span is marked, the run looks healthy.
Use Promise.allSettled or return_exceptions=True so one failure doesn't discard the others, then set a status on each child. Give every branch an outcome attribute with a small fixed vocabulary: ok, error, cancelled, timed_out. Record the exception on the span when there is one.
Cancelled branches are the easy ones to lose. If you race the branches and abandon the slow ones, those spans must still end, with outcome=cancelled. A span that never ends never exports, so the slowest branch, the one you most want, silently vanishes from the trace.
On the parent, add summary attributes: branches started, branches succeeded, branches failed. A filter on failed > 0 then finds every partly failed run without opening traces one by one. For retry behavior inside a branch, see Agent Telemetry: Trace Retries and Tool Failures.
Time spent joining results: instrument the wait and the merge
Give the join its own span, because the gap between the last branch ending and the next model call starting is real latency that belongs to nobody. After the branches finish, your code merges results, truncates or reformats them, builds the tool messages or the single tool_result message, and only then calls the model again.
Wrap that in a tools.join span, and consider two children: one for waiting (from the first branch ending to the last) and one for merging (from the last branch ending to the request being ready). If merging is slow, you'll see it. Large tool outputs that get serialized and re-tokenized are a common cause, and they also inflate the next call's input tokens.
The join span also settles an argument. When the parent is longer than its longest child, the difference is usually here. Without the span, that time is invisible and gets blamed on the model call that follows.
Separate queue delay before the fan-out from the fan-out itself
If the agent runs as a background job, time spent waiting in the queue is not fan-out time, and the trace should say so. A run that takes 12 seconds end to end may have spent 8 of them waiting for a worker, with a perfectly healthy 2 second fan-out inside.
Keep the fan-out parent scoped to the concurrent work only. Put enqueue, queue wait and processing as separate phases above it, with trace context carried across the message so the worker's spans join the same trace. The method is in Generative AI Monitoring: Trace Queued Agent Jobs.
This keeps the diagnosis honest. Slow fan-out points at a tool or the join. Slow queue wait points at worker capacity. Fix the wrong one and you lose a week.
What your code must emit and what telemetry.dev shows
Your code emits the structure and telemetry.dev receives and displays it. Keep that split in mind.
| Concern | Your app must emit | What telemetry.dev shows |
|---|---|---|
| Fan-out grouping | A parent span and one child per branch, created in the parent's context | The spans you export, with their parent-child links, durations and errors |
| Branch identity | Tool name and provider call ID as attributes | Those attributes on each span |
| Branch outcome | ok, error, cancelled or timed_out on every child |
Error status and attributes on each span |
| Join time | A separate join span around wait and merge | That span's duration beside the branches |
| Queue delay | Propagated trace context across the queue | Spans from both processes, if context is carried |
telemetry.dev traces model calls, tool steps and retrievals and tracks cost, latency, tokens and errors, and it ingests standard OpenTelemetry. telemetry.dev provides a first-party TypeScript SDK. telemetry.dev also provides a first-party Python SDK. Any OTLP/HTTP exporter works too.
The processor exports every span your provider ends, so the fan-out structure you write is the structure you get. It does not infer one. Missing instrumentation means missing detail, and the fan-out parent is the clearest example: if you don't create it, nothing groups the branches.
The free plan is $0 for 30k units with 14-day retention.
How do you monitor tool calls, traces and token usage together?
Emit one span per model call and per tool call, and attach token usage and the model name to the model spans. Tool spans carry their own duration and error status. telemetry.dev, built on OpenTelemetry, shows these as traces with latency, tokens, cost and errors, so you can find the slow step and inspect the failed call. Computed cost depends on reported token usage and a pricing match for the model, and missing instrumentation limits trace detail.
Which frameworks and providers can send agent traces to telemetry.dev?
telemetry.dev has first-party TypeScript and Python SDKs and integrations for OpenAI, Anthropic, Google Gemini, AWS Bedrock, OpenRouter, LiteLLM and the Vercel AI SDK. It also has setup guides for LangChain/LangGraph, Pydantic AI, CrewAI and Claude Code. Any OTLP/HTTP exporter works too, so existing OpenTelemetry instrumentation can send data without lock-in. An integration existing does not guarantee every framework event or attribute is captured.
Checklist for tracing parallel tool calls
Run through this before you trust a fan-out trace:
One parent span wraps the whole fan-out and carries a branch count.
Each branch is a child span created inside the parent's context, so none appear as orphan roots.
Every child carries the tool name and the provider's call ID.
Every child ends, including cancelled and timed-out ones, with an
outcomeattribute.Failures don't abort sibling branches (
Promise.allSettled,return_exceptions=True).The parent carries counts of succeeded and failed branches.
A separate join span covers waiting and merging.
Queue wait sits outside the fan-out parent.
You compare parent duration, longest child and summed children for each slow run.
What are the best practices for monitoring AI agents?
Trace every model call, tool call and retrieval as its own span, and nest parallel branches under one parent so you can see overlap. Record the outcome of every branch, including failures and cancellations. Time the wait and merge after the fan-out. Capture token counts and model names so cost can be computed. Keep span names and attributes consistent across branches so you can filter them. Review slow runs by looking at the longest branch, not the sum of durations.
What is AI agent monitoring?
AI agent monitoring is the practice of recording what an agent does in production: each model call, tool call and retrieval, with its timing, token usage, cost and errors. It exists to answer two questions after a slow or partly failed run: which step caused it, and what exactly happened inside it. For agents that fan out to parallel tools, you need to see every branch separately, not just the final response time.
How do I compare AI agent monitoring tools for production?
Compare tools on the things that affect a small team: whether they trace parallel tool calls as separate spans, how setup works with your SDKs, how pricing scales (per seat or per usage), where data is stored, and whether self-hosting is required. telemetry.dev is usage-based, not per seat, with a free plan of 30,000 units.
What governance and compliance questions come up with agent monitoring?
Start with what you capture. Prompts, tool arguments and outputs can contain personal or sensitive data, so decide what to record, redact or leave out before sending traces anywhere, and note that redaction will not catch everything. Then check where data is stored and what certifications you need.
Emit the fan-out structure, then send one slow run to telemetry.dev
Parallel tool calls don't need a new tool. They need three spans your code already has the information to write: a parent, a child per branch and a join. Add them to one agent path, export through the OpenTelemetry setup, and open a slow run on the free plan at telemetry.dev. If the parent is close to the longest child, you have found your branch. If it isn't, look at the join.
Share this article