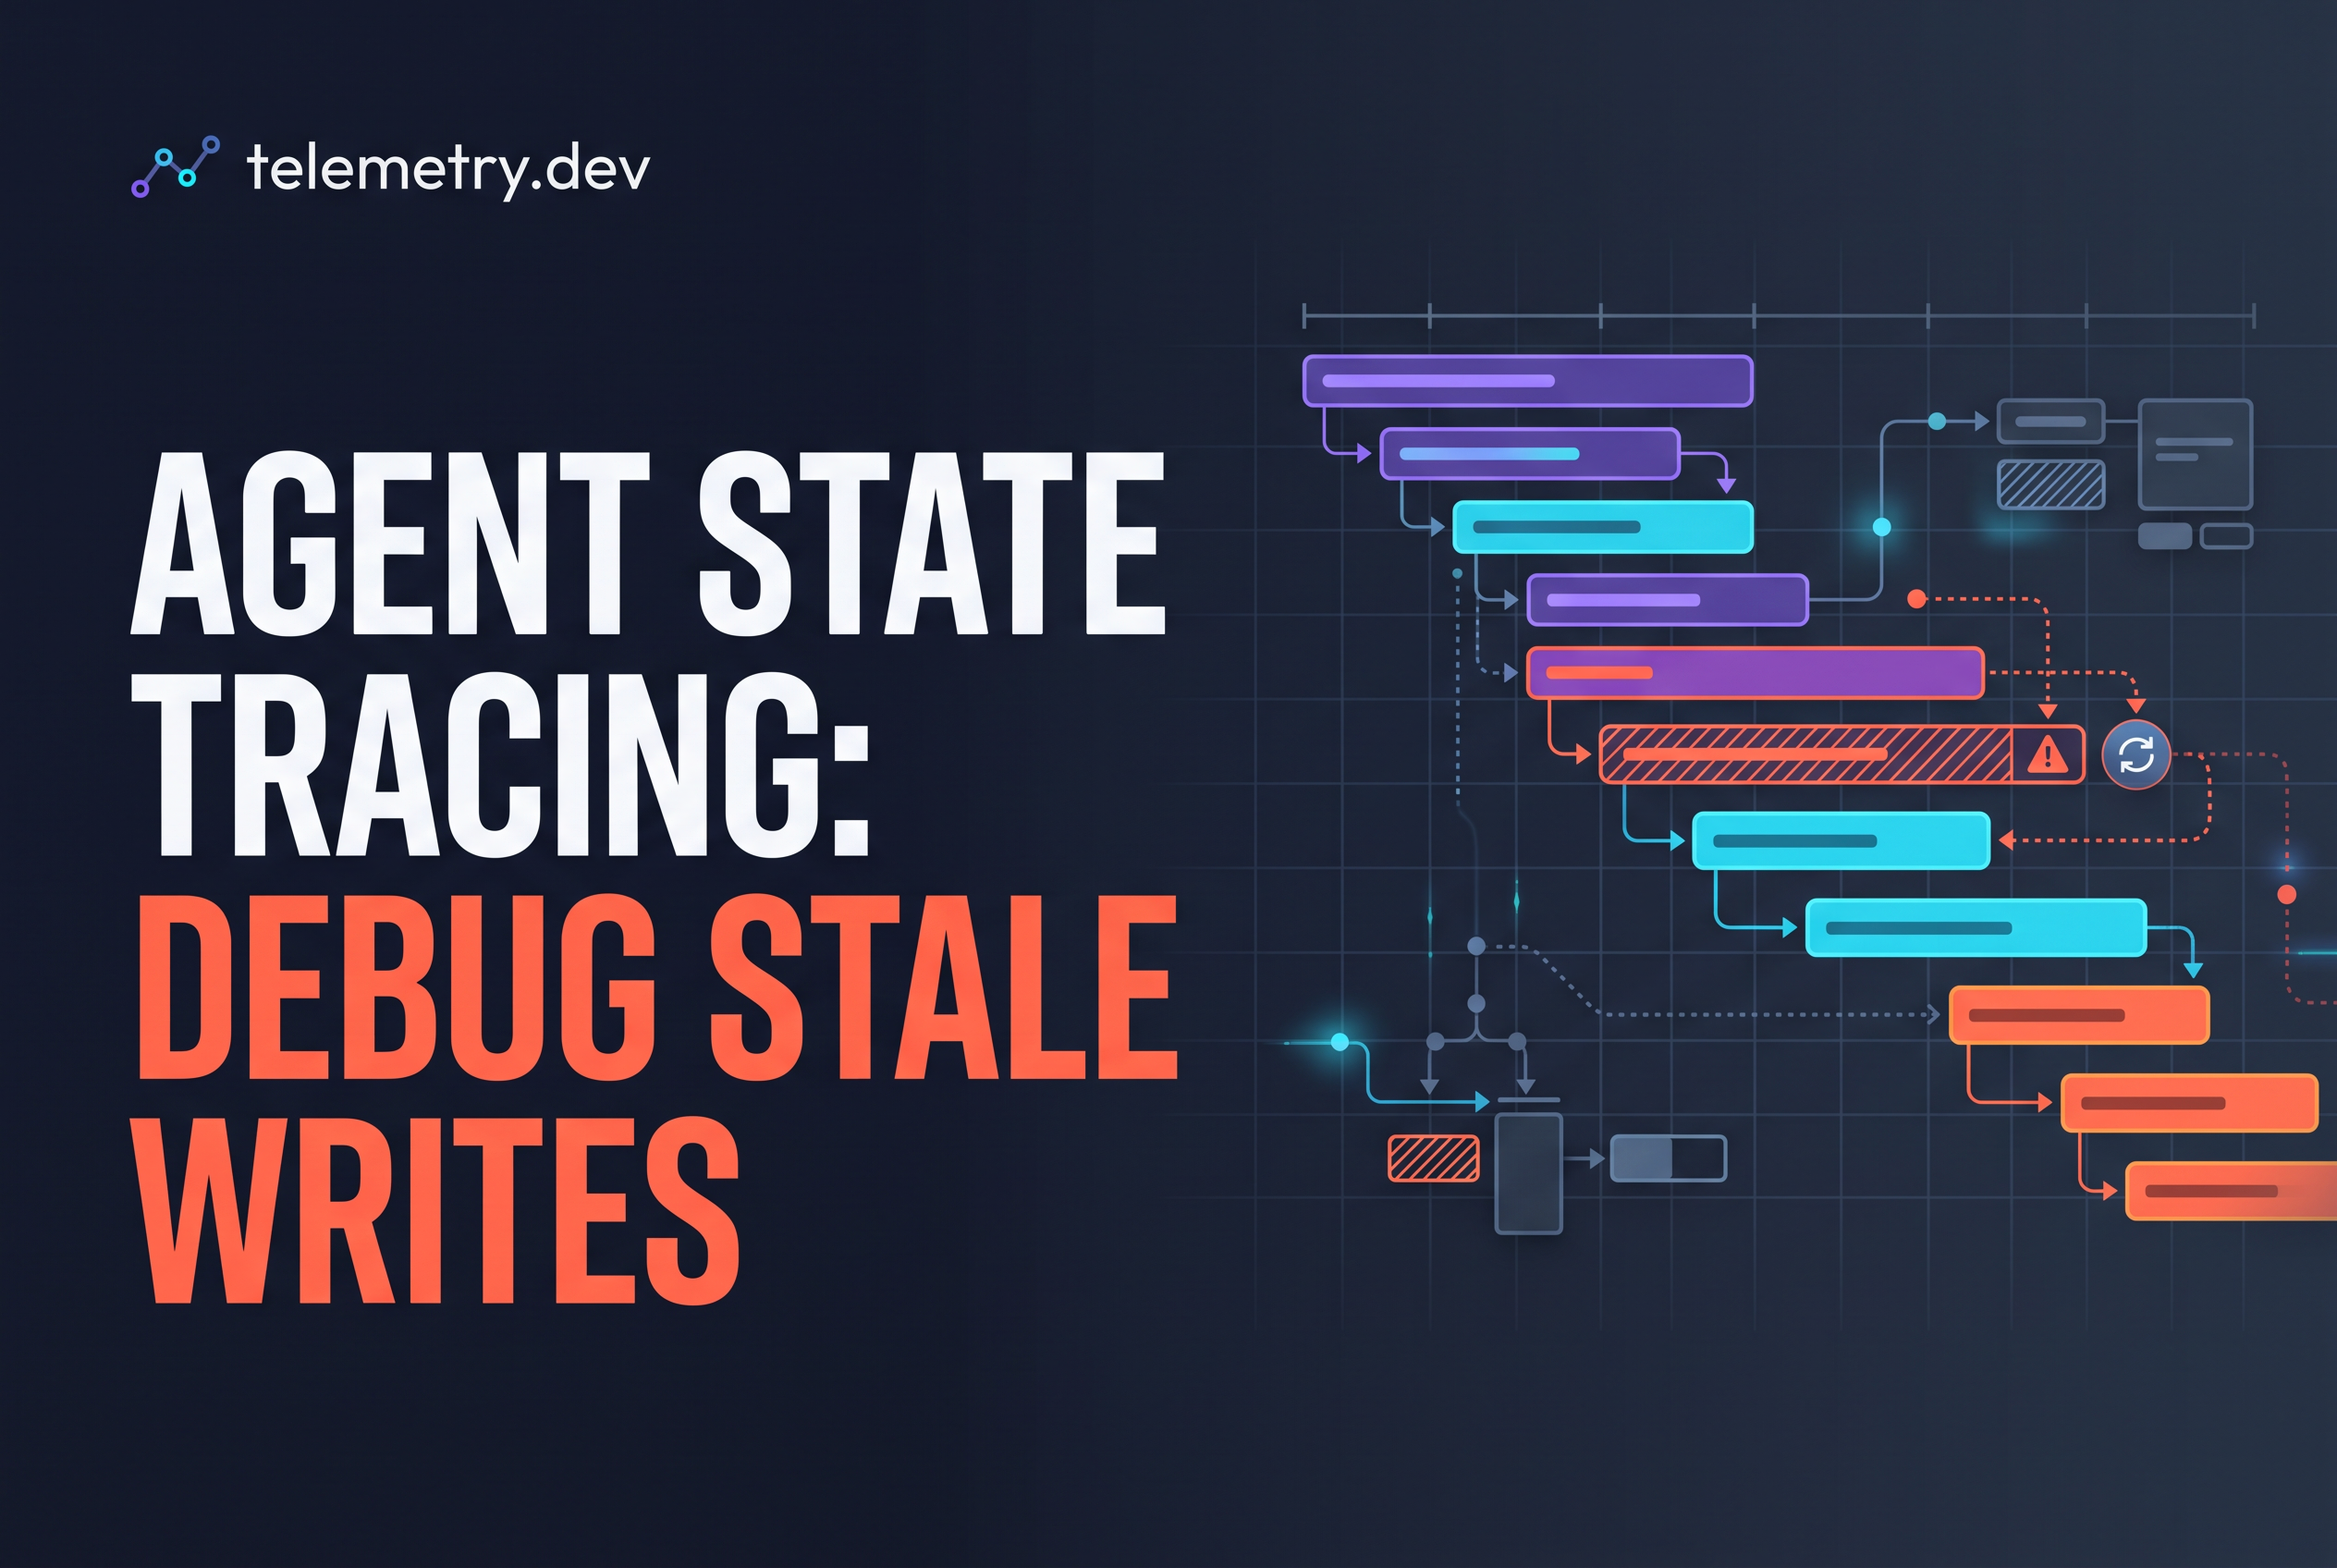
Agent state tracing means your app emits the state version it read, the version it expected to write and the commit outcome on a span, so a stale write shows up as a visible conflict instead of silently overwritten state. Every piece of that detection is instrumentation your team writes. A tracing tool won't spot a conflict on its own.
The symptom is familiar. Two runs on the same thread both load the same checkpoint. One finishes first and saves. The second finishes later and saves over it, and the first run's work is gone. Nothing errors. Latency looks normal, token counts look normal, and the user gets an answer built from outdated state.
This post shows what to emit, where to emit it, how to read the result, and what to change once the conflict is visible. It also covers how this fits into AI agent monitoring in general, since people searching for monitoring tools usually land here after a run that looked healthy and was wrong.
What a stale write is in an agent run, and why a normal trace hides it
A stale write happens when a run commits state computed from a version that is no longer current. Run A and run B read version 7. A commits and produces version 8. B commits its own result on top of version 7's assumptions and the store accepts it, now at version 9, with A's changes missing.
A normal trace hides this because every span succeeded. The model call returned, the tool call returned, the database write returned 200. Latency, tokens and cost are all fine. The failure isn't in any single operation. It sits between a read at the start of the run and a write at the end, and plain spans don't record that relationship.
Don't assume your framework catches it. A production report describes concurrent runs on the same LangGraph thread_id both saving checkpoints, which forks the history instead of raising a concurrency error. Checkpointing gives you recovery. It doesn't give you cross-run conflict control.
So the trace has to carry the evidence. You need to see, on one trace, which version the run believed was current and what happened when it tried to commit.
Instrument state reads: record the observed version on the span
Record the version at the moment you load state, on the span that does the loading. If the read span doesn't carry the version, you can't prove later which snapshot the run was working from.
Your state store needs some version marker: a monotonically increasing integer, an etag, a checkpoint ID or a row revision. Whatever it is, you read it alongside the state and put it on the span.
A minimal TypeScript sketch using the OpenTelemetry API:
const span = tracer.startSpan("agent.state.read");
const { state, version } = await store.load(threadId);
span.setAttribute("app.state.thread_id", threadId);
span.setAttribute("app.state.observed_version", version);
span.setAttribute("app.run.id", runId);
span.end();
The same shape works in Python with tracer.start_as_current_span. Keep the attribute names identical across services so one query finds every read. Record the read once per run, not once per step, unless your agent reloads state mid-run. If it does reload, emit a read span each time. Mid-run reloads are exactly where a run quietly moves from one version to another.
Instrument state commits: record the expected version, the outcome and the conflict
On commit, emit the version you expected to replace, the outcome, and the version you actually ended up with. The expected version is almost always the one you observed on read. Putting it on the commit span next to the outcome turns a silent overwrite into a labeled event.
The commit has to be a conditional write for this to mean anything. If your store only supports blind overwrites, the span will tell you the expected version was 7 and the current version was 9, but the write will still succeed. That's still useful, because you can see the damage even before you fix it.
const span = tracer.startSpan("agent.state.commit");
span.setAttribute("app.state.expected_version", expected);
const result = await store.commitIfVersion(threadId, expected, next);
span.setAttribute("app.state.commit_outcome", result.ok ? "committed" : "conflict");
span.setAttribute("app.state.current_version", result.currentVersion);
span.setAttribute("app.state.conflict", !result.ok);
span.end();
If your store can't tell you the current version on a failed write, do a cheap follow-up read and record it. A conflict span that says only "failed" is hard to act on. One that says expected 7, found 9 tells you two runs overlapped and how far ahead the other one got.
Custom attributes to emit for state reads and commits (app-defined table)
These attribute names are examples your team defines. Nothing here is a built-in or a standard convention. Pick names, document them, and keep them stable.
| Attribute | Set on | What it holds |
|---|---|---|
app.state.thread_id |
read, commit | The thread or conversation the state belongs to |
app.run.id |
read, commit | The logical run that did the work |
app.state.observed_version |
read | Version returned when state was loaded |
app.state.expected_version |
commit | Version the commit assumed it was replacing |
app.state.current_version |
commit | Version found in the store at commit time |
app.state.commit_outcome |
commit | committed, conflict, reloaded or abandoned |
app.state.conflict |
commit | Boolean, true when expected and current differ |
app.state.reload_count |
commit | How many times this run reloaded before committing |
Your code computes every one of these. If you forget to set app.state.conflict, no dashboard will invent it. That's the cost of this approach and also its strength: you decide what counts as a conflict for your store, so the signal means what you need it to mean.
If your runs resume from checkpoints, also carry a per-attempt ID so a restored run doesn't look like two runs. The checkpoint tracing guide covers the logical run ID versus attempt ID split.
Read the trace: four questions to ask when an agent used outdated state
Open the trace for the bad answer and ask four questions in order.
1. What version did the run observe? Find the agent.state.read span and read observed_version. This is the snapshot the model reasoned over.
2. What did the commit expect, and what was current? On the commit span, compare expected_version and current_version. If they differ and conflict is true, you have your stale write.
3. Which other run moved the version? Search by app.state.thread_id and look for another commit span between your read and your commit. Its app.run.id is the run that got there first. Overlapping time ranges on the same thread give it away.
4. Did the run retry or reload, and did it matter? Check reload_count and the outcome. A run that reloaded and committed cleanly handled the conflict. A run that committed with expected_version older than current_version and no conflict flag means your commit was a blind write.
These questions only work because you emitted the attributes. If the trace shows a read but no commit span, the run likely died before saving, which is a different bug. Pair this with your run-level view from AI agent monitoring: measure run success and latency so you can tell a failed run from a run that succeeded with wrong state.
Which metrics and alerts help debug agents in production?
Track latency per step, token usage, cost, error rate and, for stateful agents, commit conflicts and version gaps between read and write. Alert on spikes in errors, cost per run and any commit whose expected version differs from the stored one. When a run misbehaves, open its trace, find the slow or failed step, then compare the state version read with the version committed. Cost figures depend on reported token usage and a pricing match, so treat them as estimates, not billing.
Fixes once the conflict is visible: serialize per thread, compare-and-swap, reload and reconcile
Pick the fix that matches how often your runs overlap and whether overlap is legitimate.
Serialize per thread. If two runs on one thread should never run at once, enforce it at the application layer with a queue or lock keyed by thread_id, or reject the second request. This is the simplest fix and the right default for chat-style agents. Your traces will show it working: commit spans on one thread stop overlapping.
Compare-and-swap on an explicit version. Commit only if the stored version still equals the one you read. A backing-store transaction or a conditional update does this. The loser gets a rejection instead of silently winning. This is what turns app.state.conflict from a diagnostic into a control.
Reload and reconcile. For runs that legitimately update shared state concurrently, the losing run reloads the new version, merges its changes onto it, and retries the commit. Emit a span for the reload and increment reload_count, so you can see how often reconciliation happens and whether it converges. If it loops, you have a different problem, and the trace pattern looks like what agent loop detection describes.
Whichever you choose, keep the instrumentation. A fix you can't observe is a fix you'll doubt the next time an answer looks off.
Limits: what this does not detect, and how it relates to checkpoint tracing and replay
This approach detects only what your code reports. If a code path writes state without emitting a commit span, that write is invisible. If your store has no usable version marker, you have nothing to compare. If two runs write different fields and your merge is correct, a flagged conflict may be harmless, so decide what counts before alerting on it.
It also says nothing about whether the state was right. A run can commit cleanly against the latest version and still have written a bad value. Version tracing finds lost updates and stale reads. It can't catch wrong reasoning.
Checkpoint tracing answers a neighboring question: which attempt of a logical run did this work, and was it a resume, replay or fork. State tracing answers whether that attempt read and wrote the version it thought it did. On a restored run you want both. The attempt ID tells you which execution committed, and the version attributes tell you whether it overwrote a newer snapshot that another execution had already saved. Replays especially can commit old-based state over newer state, so emit the state attributes on replayed commits too.
What does AI agent monitoring cover beyond stale state?
Production agent monitoring covers four things: traces of model calls, tool steps and retrievals; cost, latency, token and error metrics; logs; and state integrity. Stale writes and lost updates sit in the last group, and standard tracing misses them unless you add version attributes to state reads and commits, as shown above. telemetry.dev is built on OpenTelemetry and traces model calls, tools and retrievals with cost, latency, tokens and errors. It doesn't run evaluations or manage prompts.
Can traces show runtime behavior, reasoning outcomes and drift?
Traces show what an agent did at runtime: which model calls, tools and retrievals ran, in what order, with what errors and cost. They show outcomes only for what you instrument, so add attributes for decisions and state versions. Traces don't prove the reasoning was correct or that behavior stayed within policy. Judging that needs evaluations or review. You can still spot drift by comparing cost, latency, tool-call patterns and error rates across runs over time.
How do Datadog, Splunk, New Relic and LangChain tools compare for agent monitoring?
General APM suites such as Datadog, Splunk and New Relic watch whole systems and can ingest OpenTelemetry data, but they are priced and scoped for broad infrastructure. LangChain's own tooling centres on LangChain and LangGraph runs. For a small team, the useful question is whether the tool shows the slow step and the failed call, and whether it accepts standard OTLP/HTTP so you aren't locked in. telemetry.dev isn't a general APM replacement. It focuses on LLM traces and cost, and its alternatives pages cover comparisons.
What should an agent monitoring dashboard show: spans, evals and governance?
A useful dashboard shows spans for each model call, tool step and retrieval, plus cost, latency, tokens and errors, filterable by run. Evaluations and governance controls are separate capabilities that some platforms add. telemetry.dev covers the tracing and metrics side for teams of 1 to 50 people. It doesn't offer evaluations or prompt management.
Add three attributes to one commit path this week
Visible conflicts beat clever recovery. Pick the one state commit that matters most, add observed_version, expected_version and commit_outcome, and look at a day of traces before changing any locking. You'll probably find overlaps you didn't know existed. If you want those spans in one place, send them over OTLP to telemetry.dev, filter by app.state.conflict, and start on the free plan.
Share this article