Stop guessing what your AI is doing
Every model call, tool step, and retrieval in one trace — tokens, cost, latency, and errors attached. Built on OpenTelemetry: any framework, any language, no lock-in. First trace in five minutes.
Free plan: 10k spans a month. No credit card.
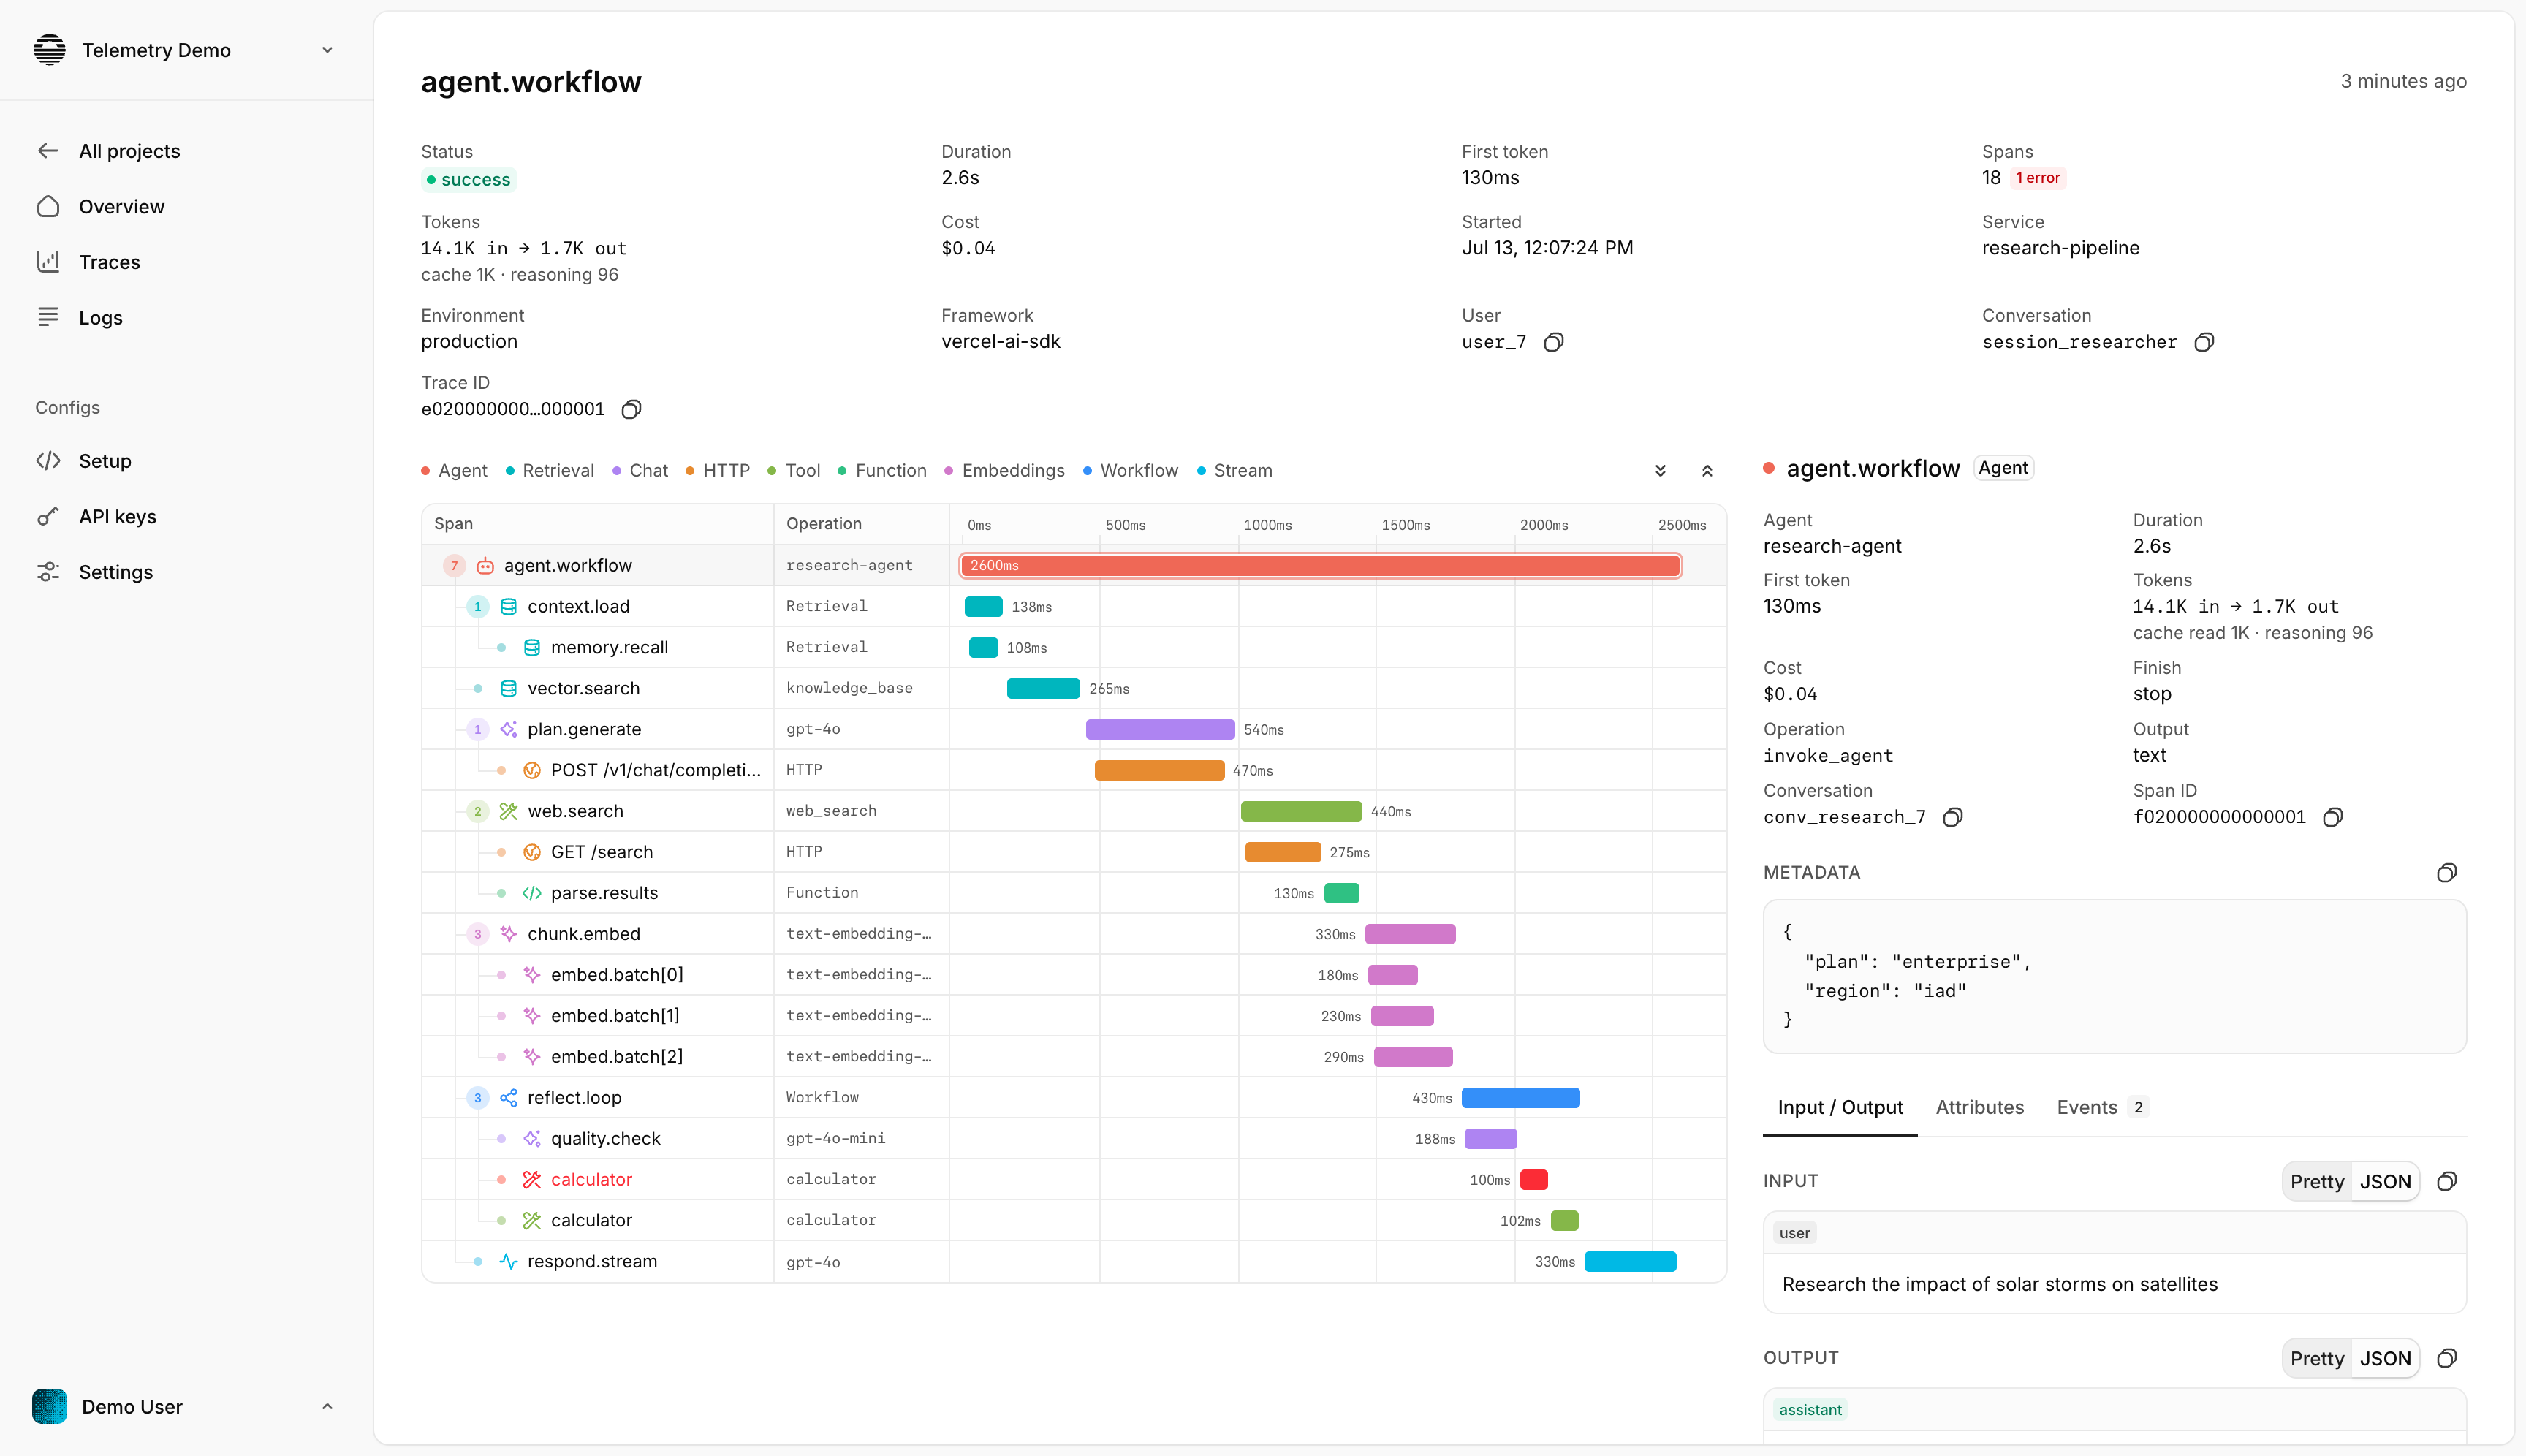
When something breaks, you'll know why
One slow request or a month of spend: the traces and metrics to answer it, fast.
Volume, cost, p95, errors
The four numbers you actually check, split by model, provider, and environment.
Failures surface as they happen
Failed calls and timeouts stream in as they happen, with error type, status, and the full trace attached.
Success rate
98%chat.completion · gpt-5.5 · 1,204 tok · $0.004
retrieval · pinecone · 8 docs · 120ms
tool · get_invoice · running
User message
LLM call · 820ms
Response streamed
Inputs and outputs, on your terms
Flip capture on per environment to store exact inputs and outputs. Secrets are redacted at ingest, and you can add your own patterns.
One bad trace in a million? Found.
Search by name, filter by status, environment, framework, or session, and open the full trace in seconds.
Send traces from anywhere
Drop in our SDK, or point any OpenTelemetry exporter at our endpoint. Any framework, any language, no lock-in.


Any framework. Any language. One endpoint.
However you added AI to your app, send the traces here. We normalize them into one model of spans, tokens, and cost.

- Connected
Vercel AI SDK
TypeScript · generateText, streamText
- Connected
LangChain
Python · agents, RAG, tools
- Connect
OpenTelemetry
Any language · OTLP/HTTP
Tokens (30d)
4.2M
Cost (30d)
$1.2K
p95 latency
1.8s
By model
By provider
By environment
Frequently Asked Questions
What is telemetry.dev?
telemetry.dev is an observability platform for AI and LLM apps. It captures every model call, tool step, and retrieval as OpenTelemetry traces, then attaches tokens, cost, latency, and errors — so you can debug failures and track spend across models, providers, and environments.
How do I start sending traces?
Drop in our SDK, or point any OpenTelemetry exporter at our endpoint. Add your project API key and your first trace shows up in about five minutes.
Which frameworks and languages are supported?
TypeScript and Python have first-party SDKs, and the Vercel AI SDK has a drop-in integration. Anything else that emits standard OTLP over HTTP — LangChain, OpenLLMetry-instrumented apps, or your own OpenTelemetry setup — works through the same endpoint. More drop-in integrations are on the way.
How is cost calculated?
Cost is computed server-side from each call's real token usage — input, output, cached, and reasoning — against current per-model pricing for 4,700+ models. There are no client-side estimates to keep in sync, and you can override cost per span when you need to.
Is the free plan actually free?
Yes, with no credit card. You get 10k spans a month, 7-day retention, one project, and two seats, free for as long as you want. Upgrade only when your volume outgrows it.
Can I keep prompts and completions out of storage?
Yes. Input and output capture is a per-environment switch, so you can store full prompts in development and none in production. Secrets like API keys are redacted at ingest, and you can add custom redaction patterns per project.
Your first trace is five minutes away
Install one package, add an API key, send a request. That's the whole setup.
Free plan includes 10k spans a month. No credit card required.