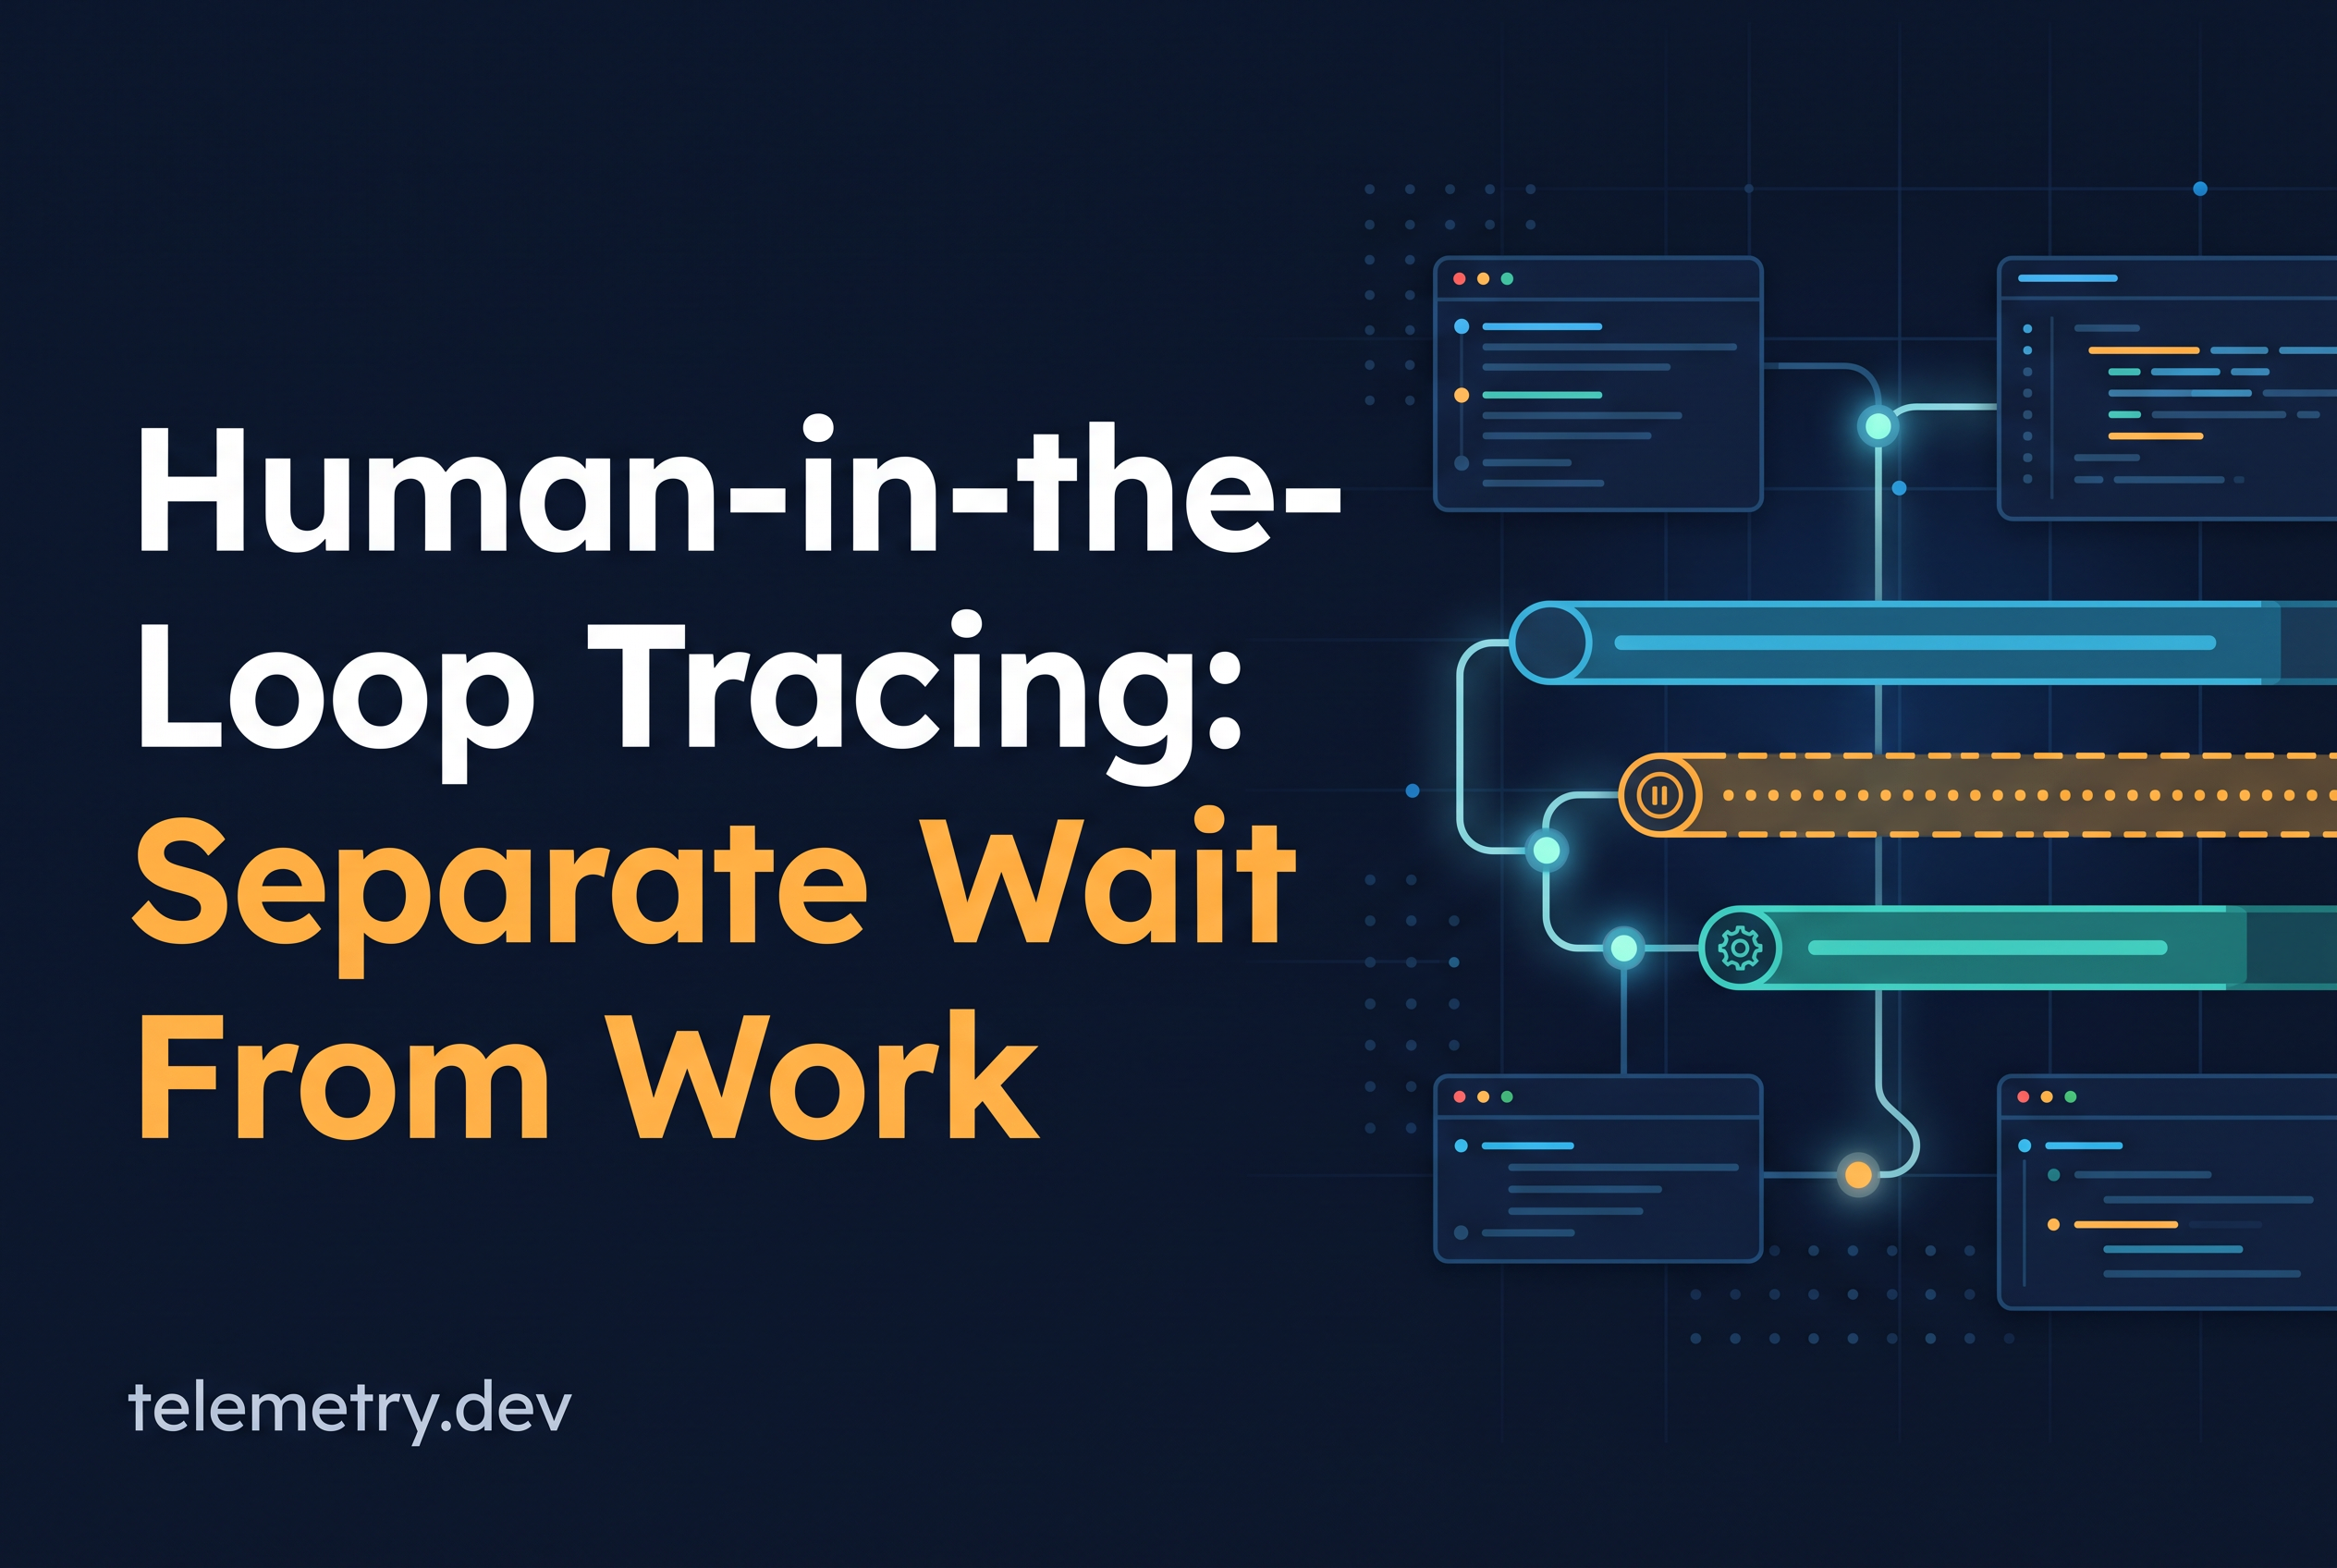
Human-in-the-loop tracing means recording an approval pause as its own measured state, so a run that waited 40 minutes for a person is not reported as an agent that ran for 40 minutes. OpenTelemetry has no built-in concept of "waiting for a human," so you model it with application-defined events, short spans and a stable run ID.
If you shipped a tool confirmation, a refund sign-off or a draft review, you have probably seen the symptom. Your p95 run duration jumped from seconds to hours, your success rate dipped, and someone asked whether the agent is broken. It isn't. The trace just has no way to say "this part was a person thinking about it."
This post gives you a pattern in generic OpenTelemetry that works in TypeScript and Python. It is not an approval feature of any product. telemetry.dev, an LLM observability service built on OpenTelemetry, receives the spans, events and attributes you emit, so you can query them like any other telemetry. The work is in how you shape them.
Why a human approval step breaks your agent latency numbers
A human approval step breaks latency numbers because the clock keeps running while nobody, human or machine, is doing agent work. Your run-duration metric measures start to finish. A reviewer who opens the confirmation at 2 a.m. adds six hours to that number, and the agent contributes nothing to it.
Three things go wrong at once. First, p95 latency becomes a measure of reviewer behavior, not model or tool performance. Second, a naive instrumentation leaves a span open for the whole pause, so you get a trace with one enormous bar and no signal inside it. Third, if the process restarts during the pause, the open span never closes and the run looks abandoned or failed.
A better dashboard won't fix this. You have to decide, in your instrumentation, which seconds belong to the human and which belong to the agent. If you already measure run success and latency with a root span per run, as described in AI Agent Monitoring: Measure Run Success and Latency, this is the next refinement.
Three clocks to measure: elapsed time, human waiting and active execution
Measure three clocks per run: elapsed time, human waiting time and active execution time. Active execution is elapsed minus human waiting, and it is the number you tune.
Elapsed time: what the user experienced from request to final outcome. Report it honestly, because it is the real wait.
Human waiting: the time between "approval requested" and "approval decided." This belongs to your product design and your reviewers.
Active execution: model calls, tool steps and retrievals before and after the pause. This belongs to your engineering team.
Compute active execution as elapsed time minus the sum of all human waiting for that run. A run can pause more than once, so sum the pauses. Put all three on the run's final record as attributes, for example run.elapsed_ms, run.human_wait_ms and run.active_ms. Then a latency chart can plot run.active_ms and tell you whether your agent got slower, while a separate chart shows whether reviewers did.
Model the pause as events and short spans, not one open span
Model the pause as a short span that ends when the agent stops, plus a second short span that starts when the person responds. Never keep one span open across the wait.
A workable shape looks like this:
The agent reaches a gated step. End the active work, then emit an
approval.requestedspan (or an event on the run's span) that records the tool name, the run ID and a request timestamp. Keep sensitive tool arguments out of the attributes.Persist what you need to resume: the run ID, the trace context and the identity of the requested span. Then let the process exit if it wants to.
When the person responds, emit an
approval.decidedspan with the decision and the decision timestamp. Compute wait time as decided minus requested and record it as a number on that span.Resume execution under a new
agent.resumespan so the post-approval work has its own clear boundary.
Short spans survive restarts, deploys and crashes because each one closes in milliseconds. An open span across a six-hour wait survives none of them. If you prefer events to spans, the same logic applies: one approval.requested event, one approval.decided event, both on spans that finish promptly.
The decision usually arrives in a different request from the one that paused the agent, often a webhook or a click in a review UI. That is a separate trace context, which is why the next section matters.
Carry a stable run ID and trace context across pause and resume
Carry a stable run ID as an attribute on every span and store the trace context with the pending approval, so the pause and the resume stay connected even when they happen in different processes.
Use two mechanisms together. The run ID is your own application-level key, something like agent.run_id, set on the root span, the request span, the decision span and the resume span. It lets you query every span for one run no matter how the traces split. Trace context is the OpenTelemetry mechanism: serialize the traceparent of the requested span when you pause, save it next to the pending approval record, and load it on resume.
On resume, start the new resume span with the stored context as its parent, not with whatever ambient context the approver's HTTP request carries. The approver's request is not part of the agent's story. For the decision itself, a span link from approval.decided back to approval.requested fits better than a parent-child relationship when the two live in separate traces.
This is the same discipline you need for any hand-off where memory is not shared. The queue case is covered in Generative AI Monitoring: Trace Queued Agent Jobs: the process that pauses and the process that resumes share nothing, so your code has to move the context. If parent and child links keep breaking in async code, LLM Tracing: Fix Async Parent and Child Span Links covers the common causes.
Record the decision without treating a pause as an error
Record the decision as an attribute with a small fixed vocabulary, and leave the span status unset or OK. A pause is a normal state of the workflow, not a failure.
Set approval.outcome to one of a few values: approved, rejected, edited or expired. Add approval.tool and, if useful, a coarse approval.reason_code. Keep free-text reviewer comments out of attributes unless you have decided they are safe to store.
Do not set an error status on the requested span, and do not raise an exception to "stop" the agent while it waits. Error status feeds error-rate charts and alert rules, and a healthy approval flow would light them up constantly.
The run's final outcome is a separate question. A rejected refund is a successful run that ended in a business decision, so give it its own run.outcome value (completed, rejected_by_human, expired, failed). Reserve true errors for things that broke: a tool call that threw, a model call that timed out, a resume that could not find its stored context. That split keeps your success rate meaningful.
How do I monitor agent behavior and outcomes at runtime?
Record each decision as a span attribute or event: the tool the agent proposed, the human outcome (approved, rejected, edited) and the final result. Trace every model call and tool step so you can inspect the reasoning path of any run. To spot drift, compare approval and rejection rates over time. A rising rejection rate often signals that the agent's behavior has shifted. Cost and capture depend on what your instrumentation reports.
Report latency, success rate and approval wait separately
Report three views separately: active latency, run success rate and approval wait. Blending them is what made the dashboard misleading in the first place.
| View | Metric | Question it answers | Who acts on it |
|---|---|---|---|
| Agent speed | p50 and p95 of run.active_ms |
Did the agent get slower? | Engineering |
| Reliability | Share of runs with run.outcome of completed or rejected_by_human, versus failed |
Do runs finish? | Engineering |
| Human wait | p50 and p95 of approval.wait_ms, by approval.tool and approval.outcome |
Where do reviewers get stuck? | Product and operations |
| User experience | p50 and p95 of run.elapsed_ms |
What did the user actually wait? | Everyone |
Use p50 and p95, not averages, since a handful of overnight approvals will wreck a mean. Choose your denominator before computing success rate: decide whether runs still awaiting approval count as in progress, and exclude them until they resolve. An expired outcome is its own bucket. It tells you reviewers never got to it, which is a product finding, not an agent bug.
The same pattern extends to other long-lived hand-offs, but keep each one in its own article. Retries, timeouts and parallel fan-out have their own traces, such as Agent Telemetry: Trace Retries and Tool Failures.
What metrics and alerts should I set for production agents?
Track active execution time, approval wait time, success rate, token usage, cost and error rate as separate series. Alert on active execution latency and error rate, not total elapsed time, because a human taking an hour to approve is normal. Alert on approval wait only if it breaches a business target. For debugging, keep a stable run ID so you can open the full trace and find the slow step or failed call.
What this pattern does not cover, and where to look in telemetry.dev
This pattern covers measurement only. It does not resume your agent, make execution durable, page anyone when an approval sits too long, or score whether the reviewer made a good call. Your application owns the pause, the stored state and the resume logic. The telemetry just describes them.
telemetry.dev gives you a place to send and inspect the result. It traces model calls, tool steps and retrievals, and tracks cost, latency, tokens and errors, with first-party TypeScript and Python SDKs and any OTLP/HTTP exporter. Your agent.run_id, approval.outcome and approval.wait_ms attributes are ordinary span attributes, so you can find the slow step or inspect the failed call for any run, and see the approval spans in the same trace view as the agent's model and tool spans.
Pricing is per workspace, not per seat: Free is $0 with 30k units and 14-day retention, Pro is $25 per month with 500k units, and Team is $50 per month with 2M units and unlimited seats. If you track 2026 tooling more broadly, the same attributes also work in whichever backend you point your exporter at.
How do I compare agent monitoring tools?
Compare tools on four things: whether they trace model calls and tool steps natively, how pricing scales, where data is stored, and whether they accept standard OpenTelemetry. telemetry.dev is a focused LLM observability tool priced per workspace, not per seat, and it is not a general APM replacement. It has setup guides for LangChain and LangGraph, and any OTLP/HTTP exporter works.
Does this cover enterprise governance and evals?
No. This pattern covers latency and cost visibility for small teams, not enterprise governance. telemetry.dev focuses on traces of model calls, tool steps and retrievals, with cost, latency, token and error tracking. If you need those, check them before choosing a tool. If your need is span-level tracing of agent runs, it fits.
What does AI agent monitoring cover in 2026?
AI agent monitoring means tracing each model call, tool step and retrieval, then tracking cost, latency, tokens and errors across a whole run. For agents with an approval step, it also means separating human wait from agent work. telemetry.dev does this on OpenTelemetry, with TypeScript and Python SDKs.
Instrument one approval step this week
A human pause is a state your agent enters. It is not a bug and not a latency regression, and your traces should say so. Pick the one approval step you already ship, add agent.run_id, emit approval.requested and approval.decided as short spans, and write run.active_ms and approval.wait_ms on the run. Then send the spans to a free telemetry.dev workspace and chart active latency next to approval wait. The two lines will stop being one confusing line.
Share this article