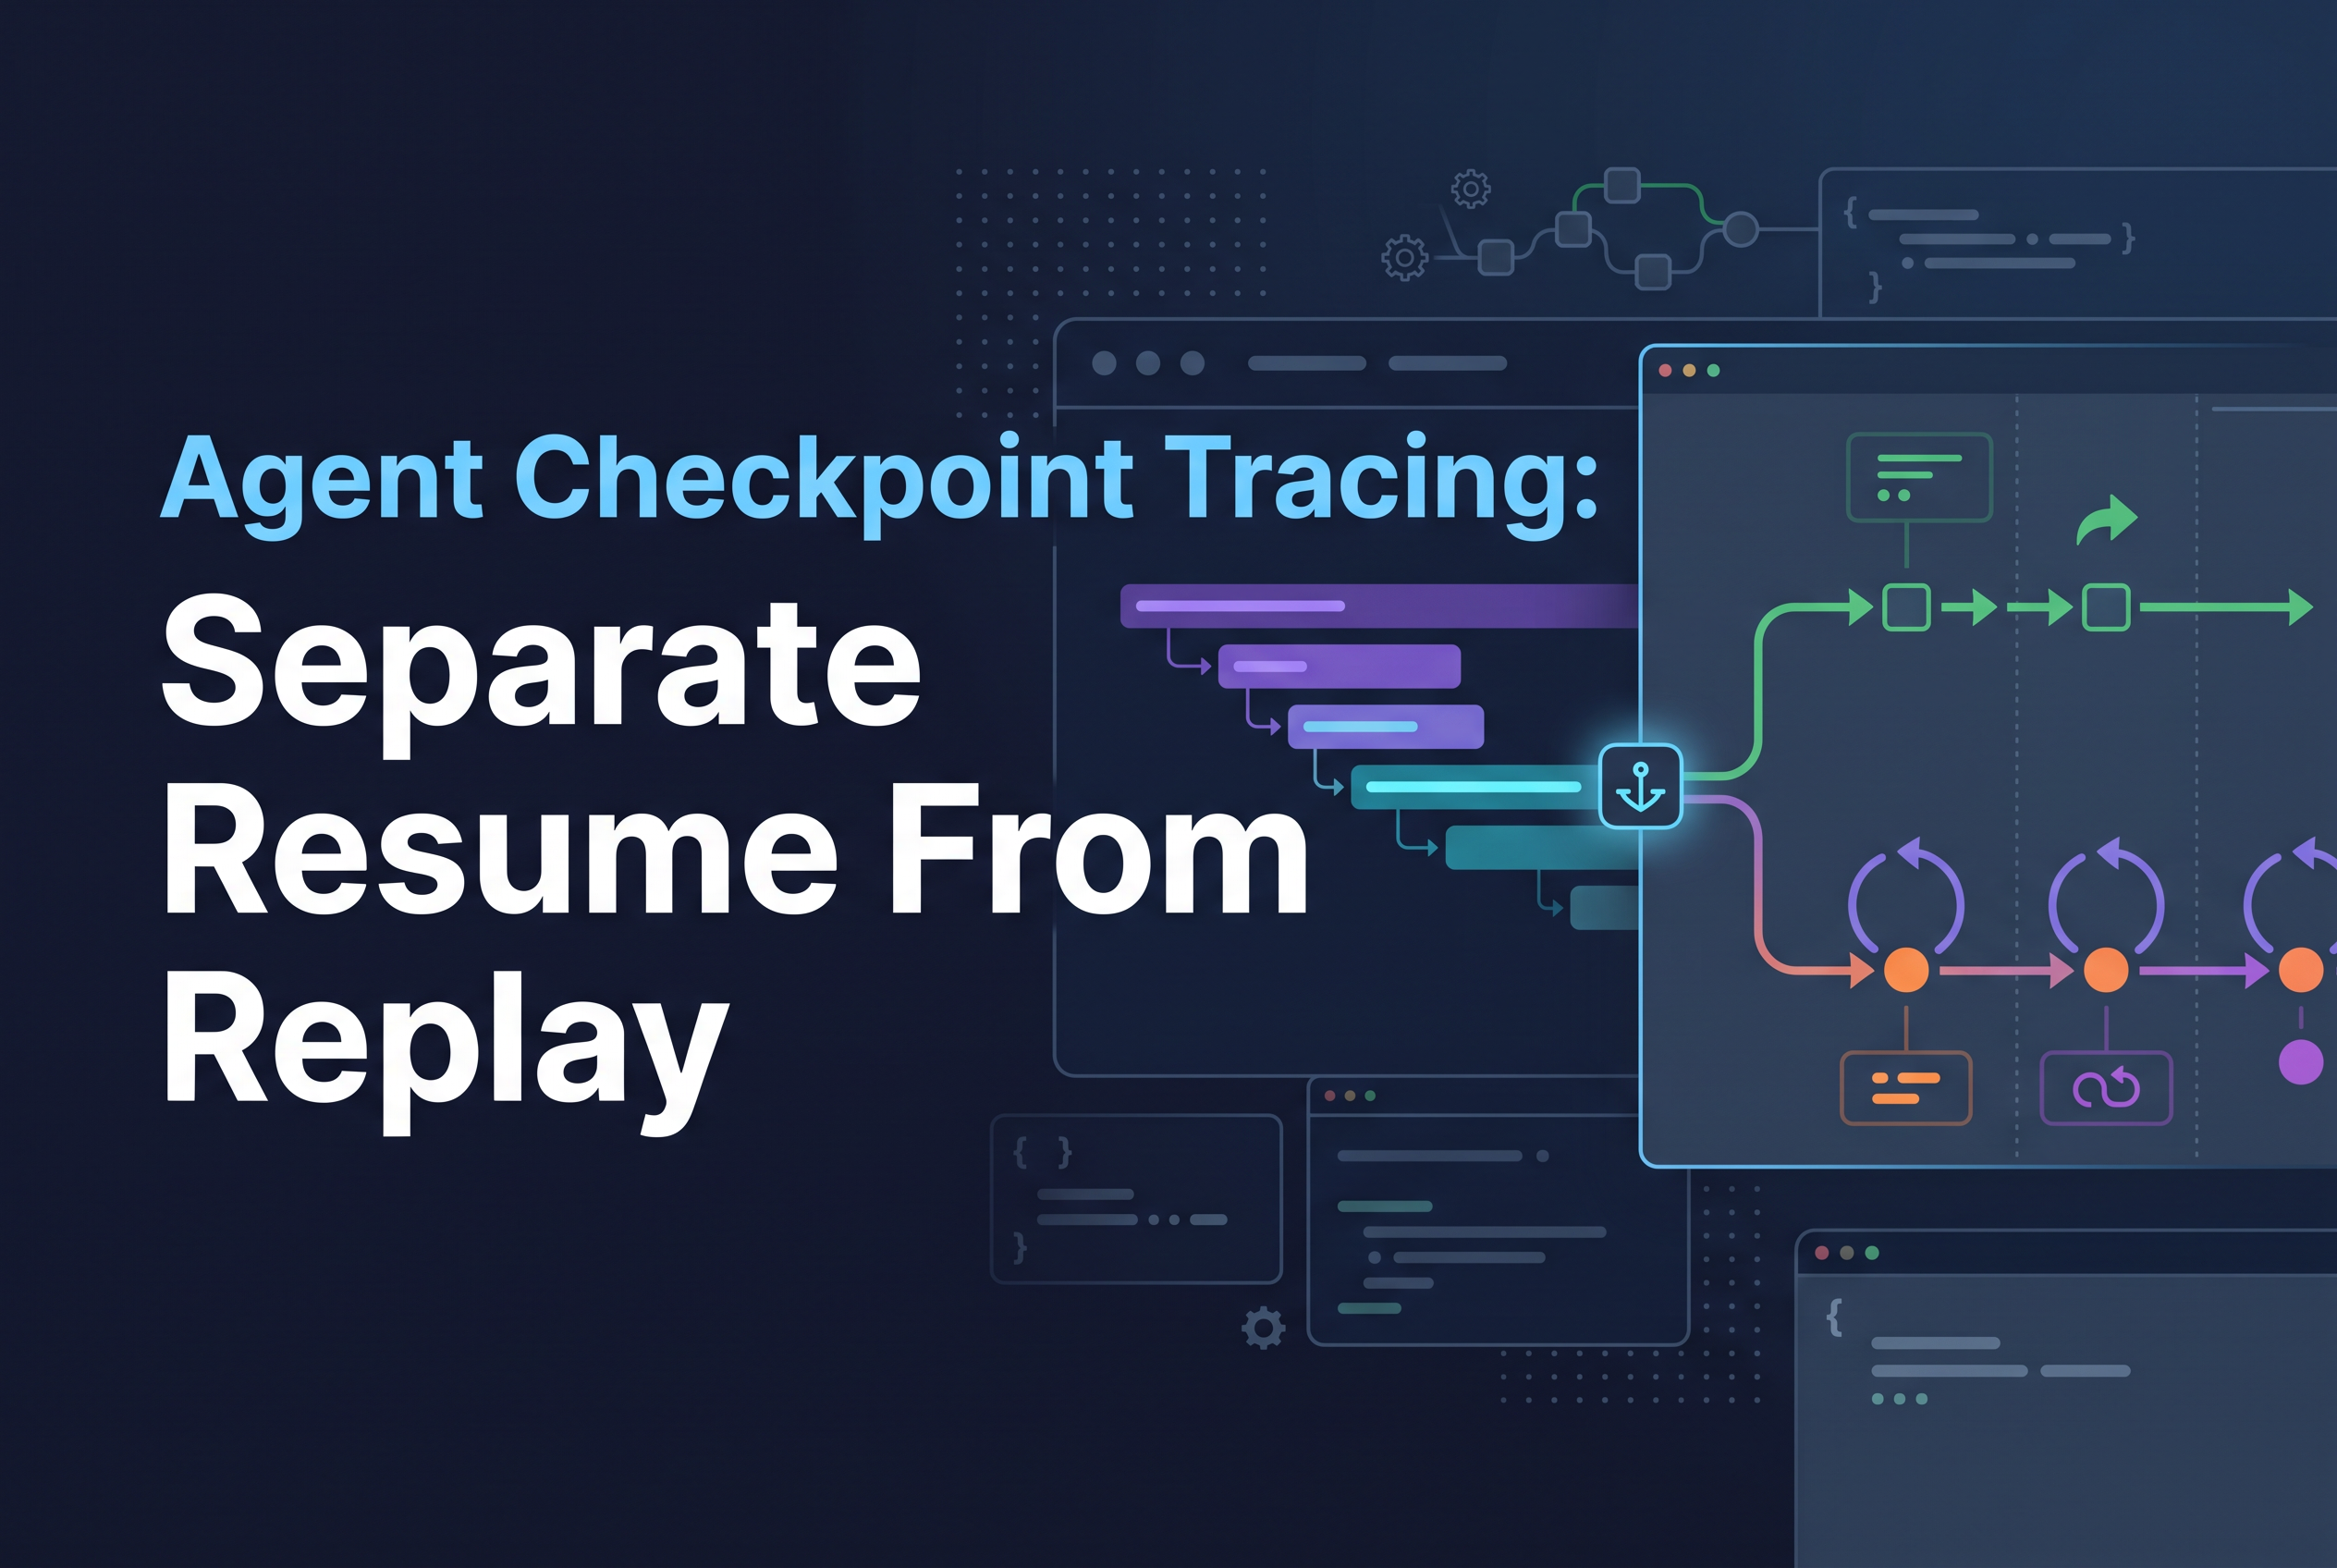
Agent checkpoint tracing means tagging every span with both a logical run ID and a per-attempt execution ID, so a restored run reads as one run with several attempts instead of several runs that double count calls and cost. The checkpoint itself is state your agent framework saves. The telemetry that explains it is something your code has to emit.
Here is the problem in one line. A run fails at step 6 of 9, you restore from the checkpoint after step 5, and the second attempt re-runs steps 6 through 9. Your trace backend sees two sets of model calls under what you think of as one run. Sum the tokens and the dashboard charges you twice for work you only needed once.
This guide shows the app-defined custom attributes that fix that. They are examples you define and emit yourself. telemetry.dev, LLM observability for AI apps and agents built on OpenTelemetry, ingests the spans and attributes your code sends, and it does not detect checkpoints or suppress replays on its own. The attribute scheme below is what makes the data trustworthy.
Why checkpoints break the one-run, one-trace assumption
A checkpoint breaks the one-run, one-trace assumption because one logical run can now execute across several separate process lifetimes, each with its own spans.
LangGraph's checkpointers save graph-state snapshots at super-step boundaries, organized by thread_id. That gives you recovery and continuation. It also means the thing you call a run is no longer a single call stack. It is a thread of state that several executions can touch.
Traces were built around a request. After a restore, the original attempt's spans already ended, possibly in a process that crashed. The new attempt starts fresh spans. Nothing in the trace model says these two belong to the same business run.
So you get two failure modes. Count by trace and one run looks like two. Sum cost by thread and replayed calls get added on top of the originals. Both are bookkeeping errors, not model errors, and both push you toward the wrong fix.
Resume, replay and fork: what each one re-executes
Resume continues unfinished work, replay re-runs everything after a chosen checkpoint, and fork re-runs from a checkpoint with changed state. Only the first adds mostly new work.
In LangGraph terms, from the search evidence on its docs:
Resume after an error: invoke with
Noneand the same thread config. Reusing a thread ID alone does not resume. If there is no unfinished work, the saved result comes back.Replay from a checkpoint: pick a snapshot with
graph.get_state_history(config)and invoke withNoneand that snapshot's config. Nodes before the checkpoint are skipped, and downstream nodes run again, so LLM calls and external API effects can happen again.Fork: update state at a prior checkpoint, then invoke from there to explore a new path.
The point for telemetry: these three do different amounts of fresh work. A resume mostly produces new calls. A replay produces calls that repeat earlier ones. A fork produces calls on a divergent path. If your spans don't say which mode produced them, you can't tell wasted spend from real progress.
Keep logical run ID separate from execution attempt ID
Keep two identifiers on every span: a logical run ID that never changes for the life of the work, and an attempt ID that changes every time an execution starts.
The logical run ID is yours to define. A good default is whatever already names the unit of work, such as your LangGraph thread_id or your own state-store key. Generate it once when the run is created and persist it with the checkpoint. Every attempt reads it back and stamps it on its spans.
The attempt ID is new per execution. Generate it at process or invocation start. A resume gets a new attempt ID with the same run ID. A replay gets a new attempt ID with the same run ID. A fork gets a new attempt ID and, usually, a new run ID or a branch ID, because it is an alternative history rather than a continuation.
Don't reuse the trace ID as the run ID. The trace ID belongs to one execution's span tree, so it changes with each attempt. That is exactly the identifier you can't rely on across a restore.
With both fields present, the two questions separate cleanly. "How many runs finished?" counts distinct run IDs. "How much did this run cost?" sums by run ID, then lets you split by attempt.
Custom attributes to emit on checkpoint, restore and replayed spans (app-defined examples)
Emit a small, fixed set of custom attributes on spans so every call says which run, which attempt and which kind of work it was.
These names are examples. You define them, you emit them, and telemetry.dev stores them as ordinary span attributes. Nothing here is a built-in checkpoint feature. Pick your own prefix and keep it stable.
| Attribute (example) | Set on | Meaning |
|---|---|---|
app.run.id |
every span | Logical run ID, constant across attempts |
app.run.attempt_id |
every span | New value per execution |
app.run.attempt_number |
root span | 1 for the first execution, 2 for the next |
app.run.work_kind |
model, tool, retrieval spans | new, resumed or replayed |
app.checkpoint.id |
checkpoint and restore spans | The checkpoint written or restored |
app.run.restored_from_checkpoint |
root span | Checkpoint this attempt started from |
app.run.fork_of |
root span of a fork | Run ID the fork branched from |
Use work_kind precisely. Mark a call new when it has never run for this run ID. Mark it resumed when it is the continuation of work that was interrupted, such as the retried node in an interrupt() restart. Mark it replayed when your orchestrator re-executes a step that already completed in an earlier attempt.
In TypeScript the pattern is a few lines on the active span:
span.setAttributes({
  "app.run.id": runId,
  "app.run.attempt_id": attemptId,
  "app.run.work_kind": "replayed",
});
In Python it is the same call with span.set_attribute. Both go through standard OpenTelemetry, so they travel on whichever span processor or OTLP/HTTP exporter you already use. If you want the run ID on every span without touching each call site, set it once as a propagated attribute at the start of the attempt.
Write the checkpoint save and the restore as their own short spans carrying app.checkpoint.id. They are cheap, and they give you the exact timestamp where one attempt ended and the next began.
What should I track on an agent run besides prompts, tool calls, errors and cost?
Track model calls with their inputs and outputs, tool calls with arguments and results, errors, latency, token counts and cost. On checkpointed agents, add attributes you define yourself: logical run ID, attempt ID, checkpoint ID, and whether a span is fresh, restored or replayed. Those let you separate real new spend from bookkeeping. Treat prompt and tool payload capture as optional, because redaction can't be relied on to catch every piece of sensitive data.
Avoid double counting: don't re-export history or count replayed bookkeeping as fresh calls
Avoid double counting by emitting spans only for work the current attempt actually executes, and by labeling re-executed work so cost reports can exclude or isolate it.
The tempting mistake is to rebuild the old trace on restore. Your restored attempt loads state, sees nine completed steps in history, and re-emits a span for each to "complete the picture." Don't. Those spans were already exported by the attempt that ran them. Re-exporting creates duplicate calls with duplicate token counts. The history lives in the earlier attempt's spans, tied together by app.run.id.
The second mistake is counting replay bookkeeping as model work. When a replay skips nodes before the checkpoint, your code may still touch them: loading state, validating it, walking the graph. That is overhead, not a model call. If you wrap it in a span, don't give it model attributes like token usage, and mark it distinctly so it never lands in a cost rollup.
A workable rule set:
One span per real execution. If the step did not run in this attempt, no span.
Model, tool and retrieval spans carry token and call data only when the call happened this attempt.
Re-executed steps get
work_kind=replayed, so you can sum them separately.Bookkeeping spans (load state, write checkpoint) carry no token usage.
Cost still depends on reported token usage and a pricing-catalog match, so replayed calls only show their real price if your spans report usage. Apply the same discipline to gateway layers. The double-counting traps are similar to those in LLM Cost Monitoring: Avoid Double Counting Gateway Spans.
Read the trace: questions to answer when a restored run is slow, costly or wrong
A restored run is easy to read once you ask four questions in order, each answerable from the attributes above.
Is it slow because of the restore itself? Compare the gap between the last span of attempt N and the first span of attempt N+1 using the checkpoint and restore spans. A long gap points at state loading or the scheduler, not the model.
Is it costly because of replay? Filter the run's spans by app.run.work_kind=replayed and sum tokens and cost. If that number is a large share of the run total, your restore point is too early or your steps aren't idempotent enough to skip.
Is it wrong because state diverged? Compare app.checkpoint.id on the restore span with the checkpoint you expected. A restore from a stale checkpoint reruns steps whose outputs may differ from the first attempt, which is how a run produces a different answer the second time.
Did a fork get mistaken for a resume? Check app.run.fork_of. A fork is a new history, so its cost belongs to a new run, not the parent.
This is the same style of reading that AI Agent Monitoring: Measure Run Success and Latency applies to run-level success. Checkpoint attributes make the run boundary honest.
What are best practices for monitoring agents in production?
Watch cost, latency, token usage and error rate per logical run, not per attempt, and alert when retries or resumes push a run well above its normal cost or duration. For debugging, start from the slowest or failed span, then check whether it was a fresh call or a replay. Keep the logical run ID stable across attempts so one run reads as one story. Alert thresholds depend on your workload, so set them from your own baseline.
Checklist, limits, and how this differs from our queue and handoff guides
Use this checklist before you trust any restored-run trace.
Generate a logical run ID once and persist it with the checkpoint.
Generate a new attempt ID on every execution start.
Stamp both on every span, plus
work_kindon model, tool and retrieval spans.Emit short checkpoint-save and restore spans with the checkpoint ID.
Never re-export spans for steps the current attempt did not run.
Keep bookkeeping spans free of token usage.
Count runs by distinct run ID, never by trace.
A few limits to keep in mind. Every attribute here is something your code must emit. Your framework's checkpointer won't add them, and telemetry.dev does not infer checkpoints or filter replays. Cost and token figures depend on spans reporting usage. And if a process crashes before it exports, those spans are simply missing, so a gap in attempt numbers is a signal, not noise.
This guide is narrow on purpose. If your problem is work crossing a message queue, read Generative AI Monitoring: Trace Queued Agent Jobs, which covers carrying trace context through a producer and a worker. If your problem is work passing between agents, read Agent Handoff Tracing: Follow Work Across Agents. Checkpoint tracing is about one run that restarts, not one run that travels.
Is telemetry.dev an enterprise agent monitoring and governance platform?
No. telemetry.dev is built for small teams of 1 to 50 people who want traces, cost, latency, tokens and errors for agents without a heavy setup. If you need formal governance, procurement reviews or evals in one platform, it's not the right fit.
How does telemetry.dev compare with general APM tools for agent monitoring?
telemetry.dev is focused on LLM and agent telemetry, not general application performance monitoring, so it isn't a replacement for a full APM suite. It traces model calls, tools and retrievals, and works with LangChain/LangGraph, Pydantic AI, CrewAI and the Vercel AI SDK, plus any OTLP/HTTP exporter, so you aren't locked in. For side-by-side details, see the comparison pages at telemetry.dev/alternatives.
What is AI agent monitoring?
AI agent monitoring is recording what an agent does at run time: each model call, tool step and retrieval, with latency, token usage, cost and errors, tied together as a trace. For checkpointed agents it also means separating a logical run from its execution attempts, so a resume or replay doesn't look like a brand new run. telemetry.dev collects this through OpenTelemetry-based tracing with TypeScript and Python SDKs, or any OTLP/HTTP exporter.
How do I monitor agent runtime behavior, reasoning and drift?
Monitor what the trace shows: the sequence of model calls and tool steps, the arguments passed, the results returned and the final outcome. Reasoning is only visible if your app records it as span data. Drift shows up as changes over time in step counts, tool choice, latency, token use or error rate for the same task. Judging whether an outcome was correct is a check you build yourself.
Tag attempts now, so the next restore doesn't corrupt your cost data
A checkpoint turns one run into several executions, and your traces will quietly lie about count and cost until you label them. Add a run ID and an attempt ID to your spans this week, mark replayed work, and stop re-exporting history. Then send the spans to telemetry.dev through its TypeScript or Python SDK or any OTLP/HTTP exporter, start on the free plan at 30k units, and filter by your run ID attribute to see one restored run end to end.
Share this article