Generative AI monitoring loses the trace at the queue because the process that enqueues an agent job and the process that runs it share no memory, so your own code has to carry trace context across the message. If it doesn't, you get two disconnected traces: a fast enqueue span in your API and an orphaned worker trace with no idea who asked for it or how long the job waited.
That gap hides the numbers you care about most. Was the job slow because the model was slow, or because it sat in Redis for 40 seconds behind a batch? Which user's request produced the spend? This post covers one narrow problem: agent jobs crossing a durable queue (Redis, SQS, Postgres-backed or similar) into a worker. The code is illustrative and application-owned. You write the inject and extract steps yourself with standard OpenTelemetry APIs.
Why generative AI monitoring loses the trace at the queue
The trace stops at the queue because context propagation only works when something moves the context between processes, and a queue client does not do that for you by default. OpenTelemetry defines propagation as the mechanism that moves context between services and processes. Over HTTP, instrumentation libraries usually handle it through headers. Over your own job queue, nobody does, unless you wrote it.
This is a different problem from the usual list of hallucinations and prompt injection. It's plumbing. An agent job is enqueued in one process and run in another, often minutes later, often after a retry. Without carried context, the worker starts a new root trace.
Two existing guides cover neighboring problems. LLM Tracing: Fix Async Parent and Child Span Links handles async work inside one process. AI API Middleware: Trace App and Provider Boundaries handles the HTTP boundary between your app and a provider. This post is the durable-queue boundary, where the context has to survive being serialized into a message and sitting in storage.
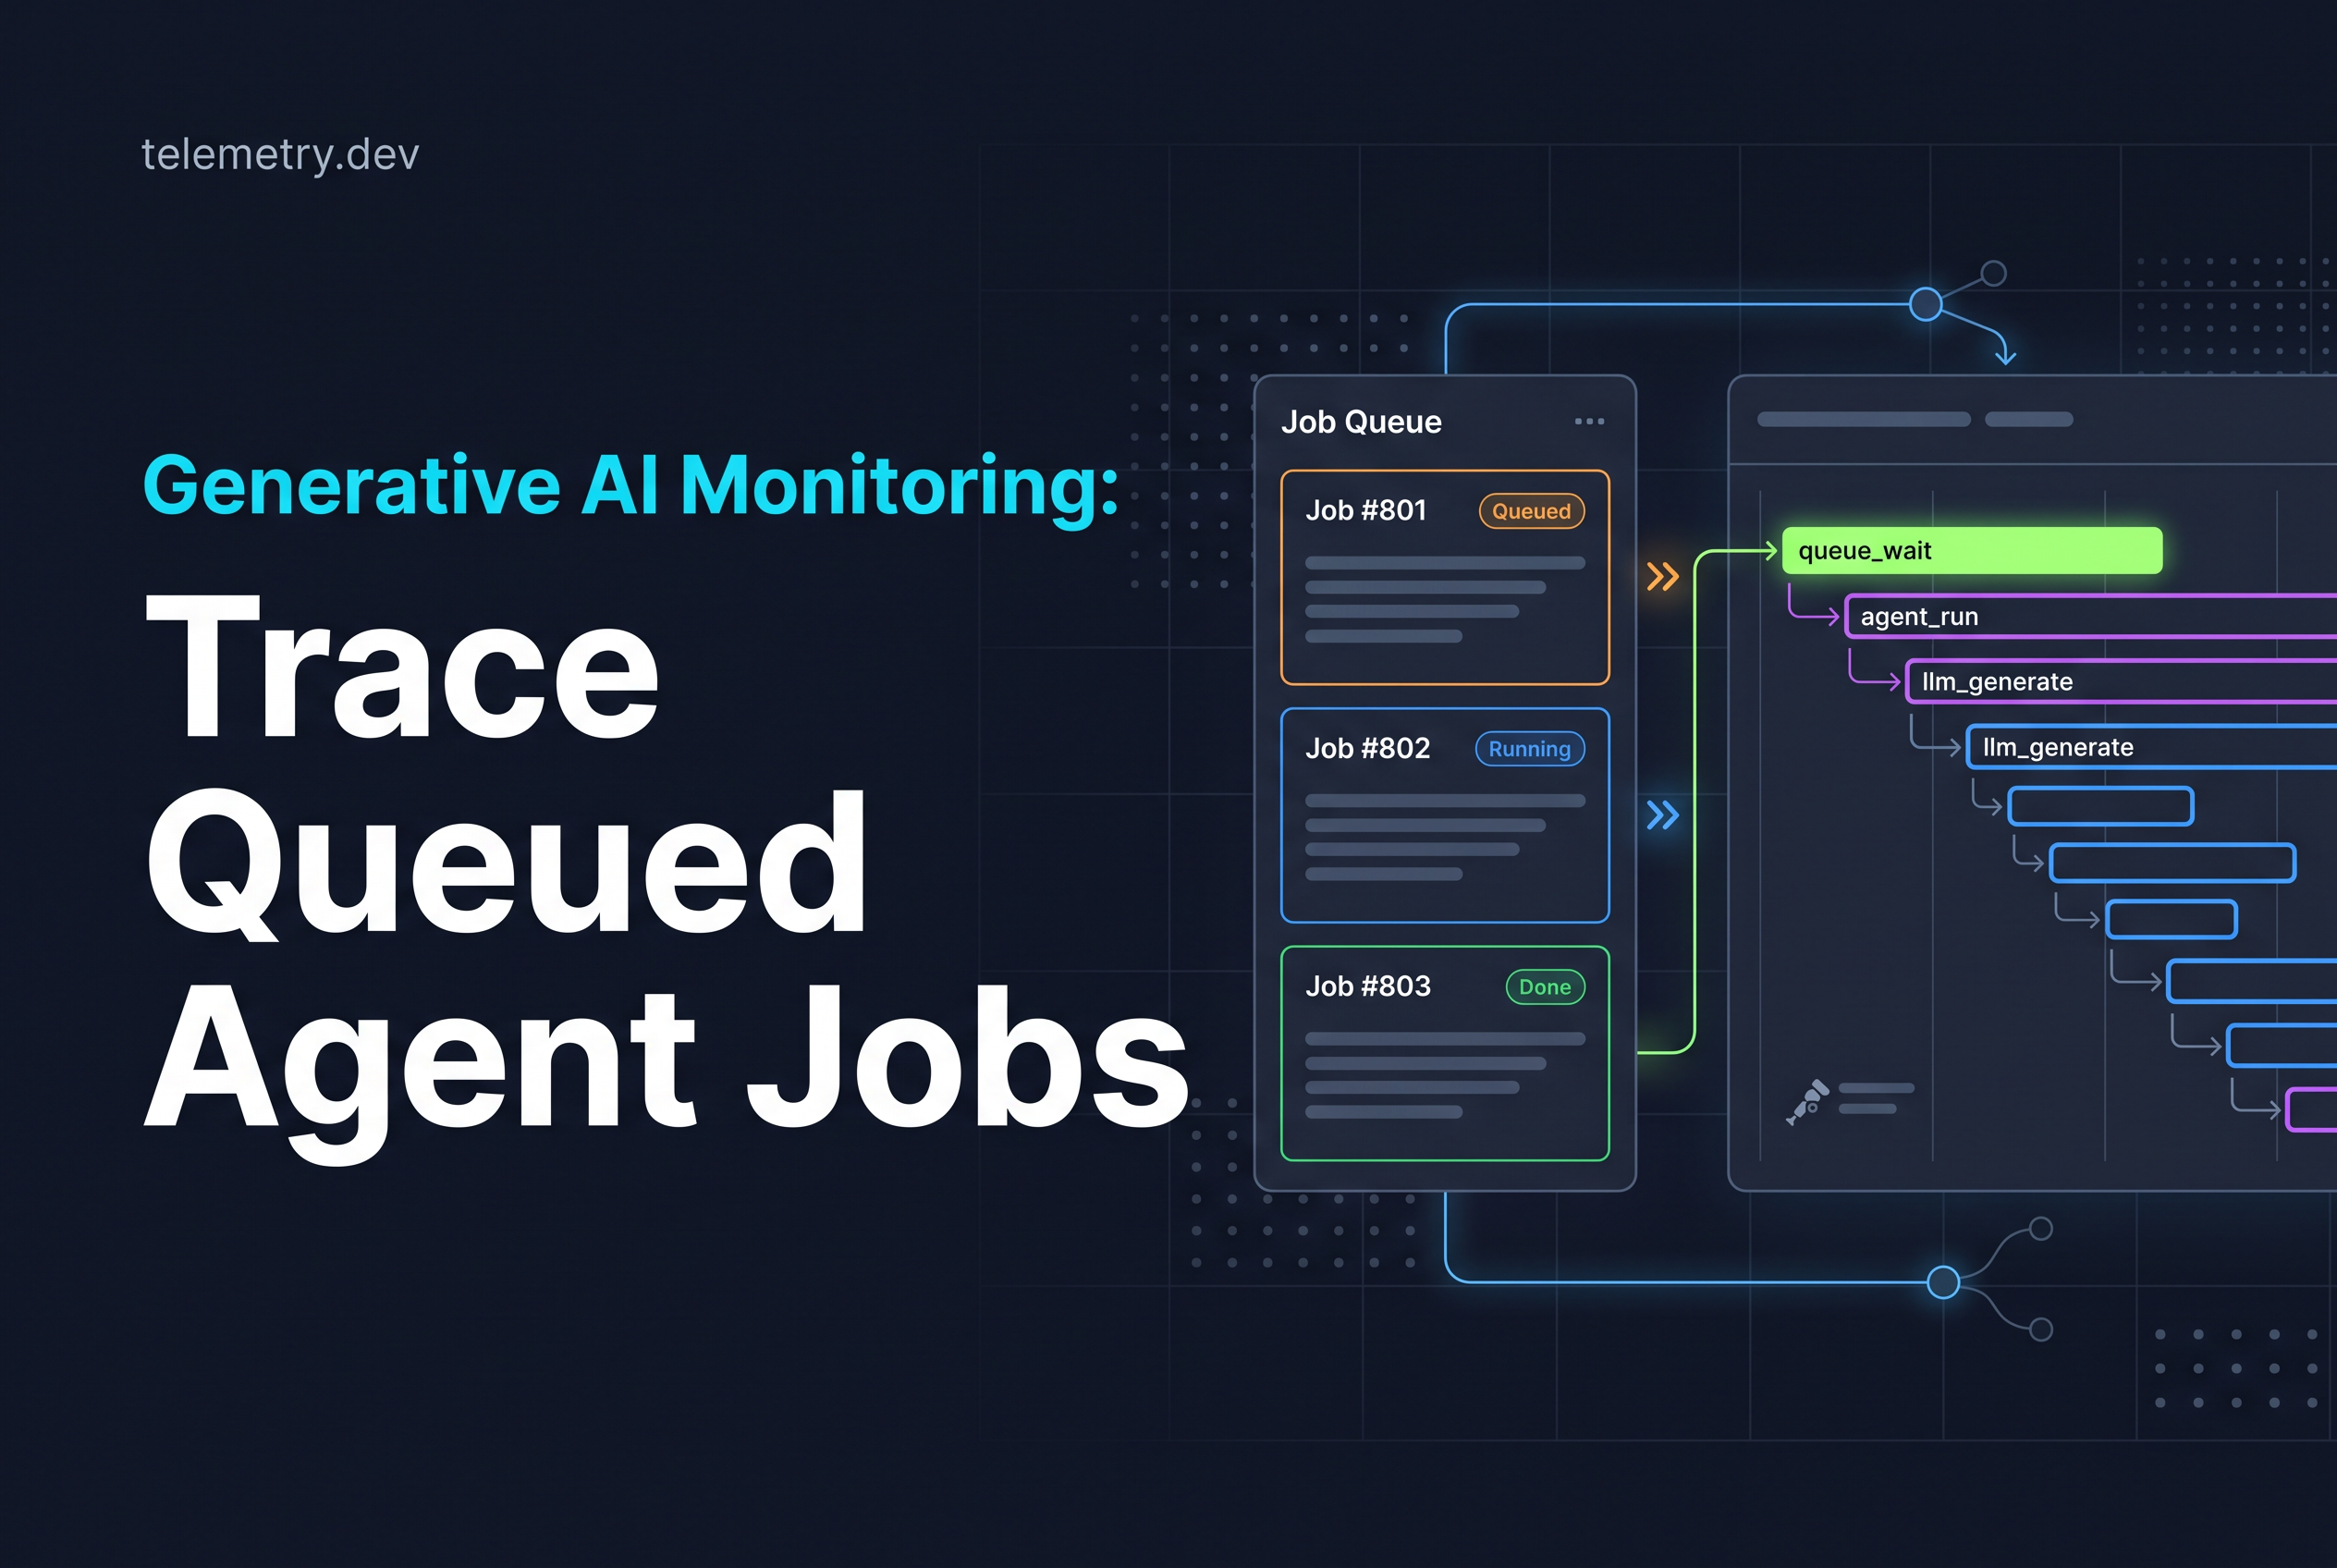
Three phases to measure: enqueue, queue wait and processing
Measure three separate phases. Collapse them into one "job duration" number and queue backlog starts to look like model latency. The three are enqueue (your producer writes the message), queue wait (the message sits durable), and processing (the worker runs the agent).
The OpenTelemetry messaging conventions name these operations: create and send for the producer side, receive for pull-based message requests, process for consumer processing (typically in push-based scenarios), and settle for settlement operations. A process span is a consumer span. A send span is a producer span when its context is injected as the message's creation context.
Queue wait has no span of its own, because nothing is executing. Derive it. Put an enqueue timestamp in the message, and when the worker starts, record the difference as an attribute or metric. Here is illustrative TypeScript you own:
// producer
const carrier: Record = {};
propagation.inject(context.active(), carrier);
await queue.add("agent-job", {
  payload,
  meta: { ...carrier, enqueuedAt: Date.now() },
});
// worker
const parent = propagation.extract(ROOT_CONTEXT, job.meta);
const waitMs = Date.now() - job.meta.enqueuedAt;
await tracer.startActiveSpan(
"agent-job process",
{ kind: SpanKind.CONSUMER, attributes: { "job.queue_wait_ms": waitMs } },
parent,
async (span) => { /* run the agent */ span.end(); }
);Now "slow job" splits into "slow queue" and "slow agent".
Which performance metrics should you track for generative AI?
Track end-to-end job latency split into enqueue time, queue wait and processing time, so you know whether the delay is in your queue or your model. Within processing, measure per-call latency, input and output tokens, error rate and retry count. Add cost per job, with the caveat that it is only as accurate as the reported token usage and the model pricing match. Watch percentiles such as p95 rather than averages, because slow outliers drive most user-visible problems.
Inject and extract context safely across the queue boundary
Inject at the producer, extract at the worker, and treat the carried data as untrusted input, because a message is a boundary you may not fully control. OpenTelemetry's guidance on security notes that propagation sends and receives data across service boundaries, which has security implications.
Follow these rules:
Inject through the propagator API, not by hand-writing header strings. W3C TraceContext is the default propagator, but
extractuses the configured propagator rather than inherently expectingtraceparent.Store the carrier in a dedicated metadata field, separate from the job payload, so a payload schema change never breaks tracing.
On extract, tolerate a missing or malformed carrier. If extraction fails, start a fresh root span and add a link to nothing. Never fail the job because tracing metadata is bad.
Do not trust a carrier from an external or untrusted producer to set your sampling or parent. If jobs can arrive from outside your system, start a new trace and record the incoming context as a link instead.
Wrap inject and extract in two small functions your whole codebase uses. One place to fix beats forty.
Choose a message metadata allowlist (and what to keep out)
Define an allowlist of metadata keys that may ride on a message and keep everything else out, because queue messages are stored, replayed and often visible in dead-letter tooling. The carrier is the only tracing data that must travel. Everything else is optional.
A sensible allowlist for agent jobs:
Trace context carrier (
traceparent, optionallytracestate)Enqueue timestamp, for queue wait
Job type and attempt number
A stable job ID you generated
Keep these out of metadata: prompts, retrieved documents, user emails, API keys, and full model outputs. Baggage needs special care. It propagates arbitrary key-value pairs, and OpenTelemetry's security guidance flags it as something to handle deliberately. Propagate a user identifier through baggage into every downstream call and you've leaked data into places you never intended.
This also bounds your data-leakage risk in generative AI monitoring. Prompt capture is a separate decision from context propagation. For that decision, see OpenTelemetry GenAI Prompt Capture: Inspect Before Export.
Parent or span link: batches, long-lived jobs and retries
Use a parent when one message maps to one unit of work. Use span links when the relationship is many-to-one, delayed, or repeated. A link says "this work was caused by that context" without forcing a single parent-child tree.
The messaging conventions are explicit about batches: a send, receive, process or settle span may cover multiple messages, and consumer spans should link to the creation contexts of the messages, especially when processing a batch, rather than picking one message as the parent for all of them.
Apply it like this:
| Situation | Use |
|---|---|
| One message, one worker run, short wait | Parent from extracted context |
| Worker pulls a batch of N jobs | New consumer span with N links |
| Job waits hours or days | Link, so the trace does not stay open |
| Retry after failure | New process span per attempt, each linked to the original creation context |
For retries, a link per attempt keeps each try as its own bounded span while still pointing back to the request that started it. For what to measure inside those retries, read Agent Telemetry: Trace Retries and Tool Failures.
What the worker's model, tool and retrieval spans add, and where cost data stops
Once the worker's process span is connected, the model, tool and retrieval spans nested under it give you the generative AI observability signals buyers ask about: prompt tracing, latency per step, token usage and errors. Without the queue link, those spans exist but belong to an anonymous trace.
This is where telemetry.dev fits. telemetry.dev is LLM observability for AI apps and agents, built on OpenTelemetry, that traces model calls, tool steps and retrievals and tracks cost, latency, tokens and errors. It documents a TypeScript SDK and a Python span-processor integration and supports sending spans through a standard OTLP/HTTP exporter, so the queue-boundary code above stays yours and the worker's spans export through standard OTLP.
Be precise about cost. Computed cost needs reported token usage and a matching model price, so a call with missing usage or an unmatched model will not produce a trustworthy number. Treat cost on a queued job as a sum over the model spans that did report usage. It is not billing reconciliation. For linking spend to runs, see AI Cost Observability: Trace Spend to Agent Runs.
Other tools in this space include Langfuse, LangSmith and Helicone, plus cloud options such as Amazon CloudWatch. Compare any of them on three criteria: does it ingest standard OTLP, can it show your queue wait next to model spans, and what does it cost per workspace versus per seat. telemetry.dev offers Free at $0 (30k units, 14-day retention), Pro at $25 per month (500k units), and Team at $50 per month (2M units, unlimited projects and seats).
How do metrics, traces and logs each help with generative AI?
Traces show the path of one job: which model call, tool step or retrieval was slow or failed. Metrics show trends across many jobs, such as token use, latency percentiles and error rates. Logs hold the detail of a single event, such as an error message or a retry reason. You need all three, but traces do the most work for agents because they connect a queue delay to the model call behind it. telemetry.dev tracks tokens, cost, latency and errors from OpenTelemetry telemetry.
Checklist for monitoring queued agent jobs, and how this differs from our other tracing guides
Use this checklist before you trust any queued-job trace:
Inject context into a dedicated metadata field at enqueue.
Record an enqueue timestamp and compute queue wait in the worker.
Extract defensively, and start a fresh root if the carrier is missing.
Allowlist metadata keys and keep prompts and secrets out.
Use a parent for one-to-one jobs, links for batches, long waits and retries.
Confirm worker model, tool and retrieval spans nest under
process.Treat cost as partial wherever usage or pricing is missing.
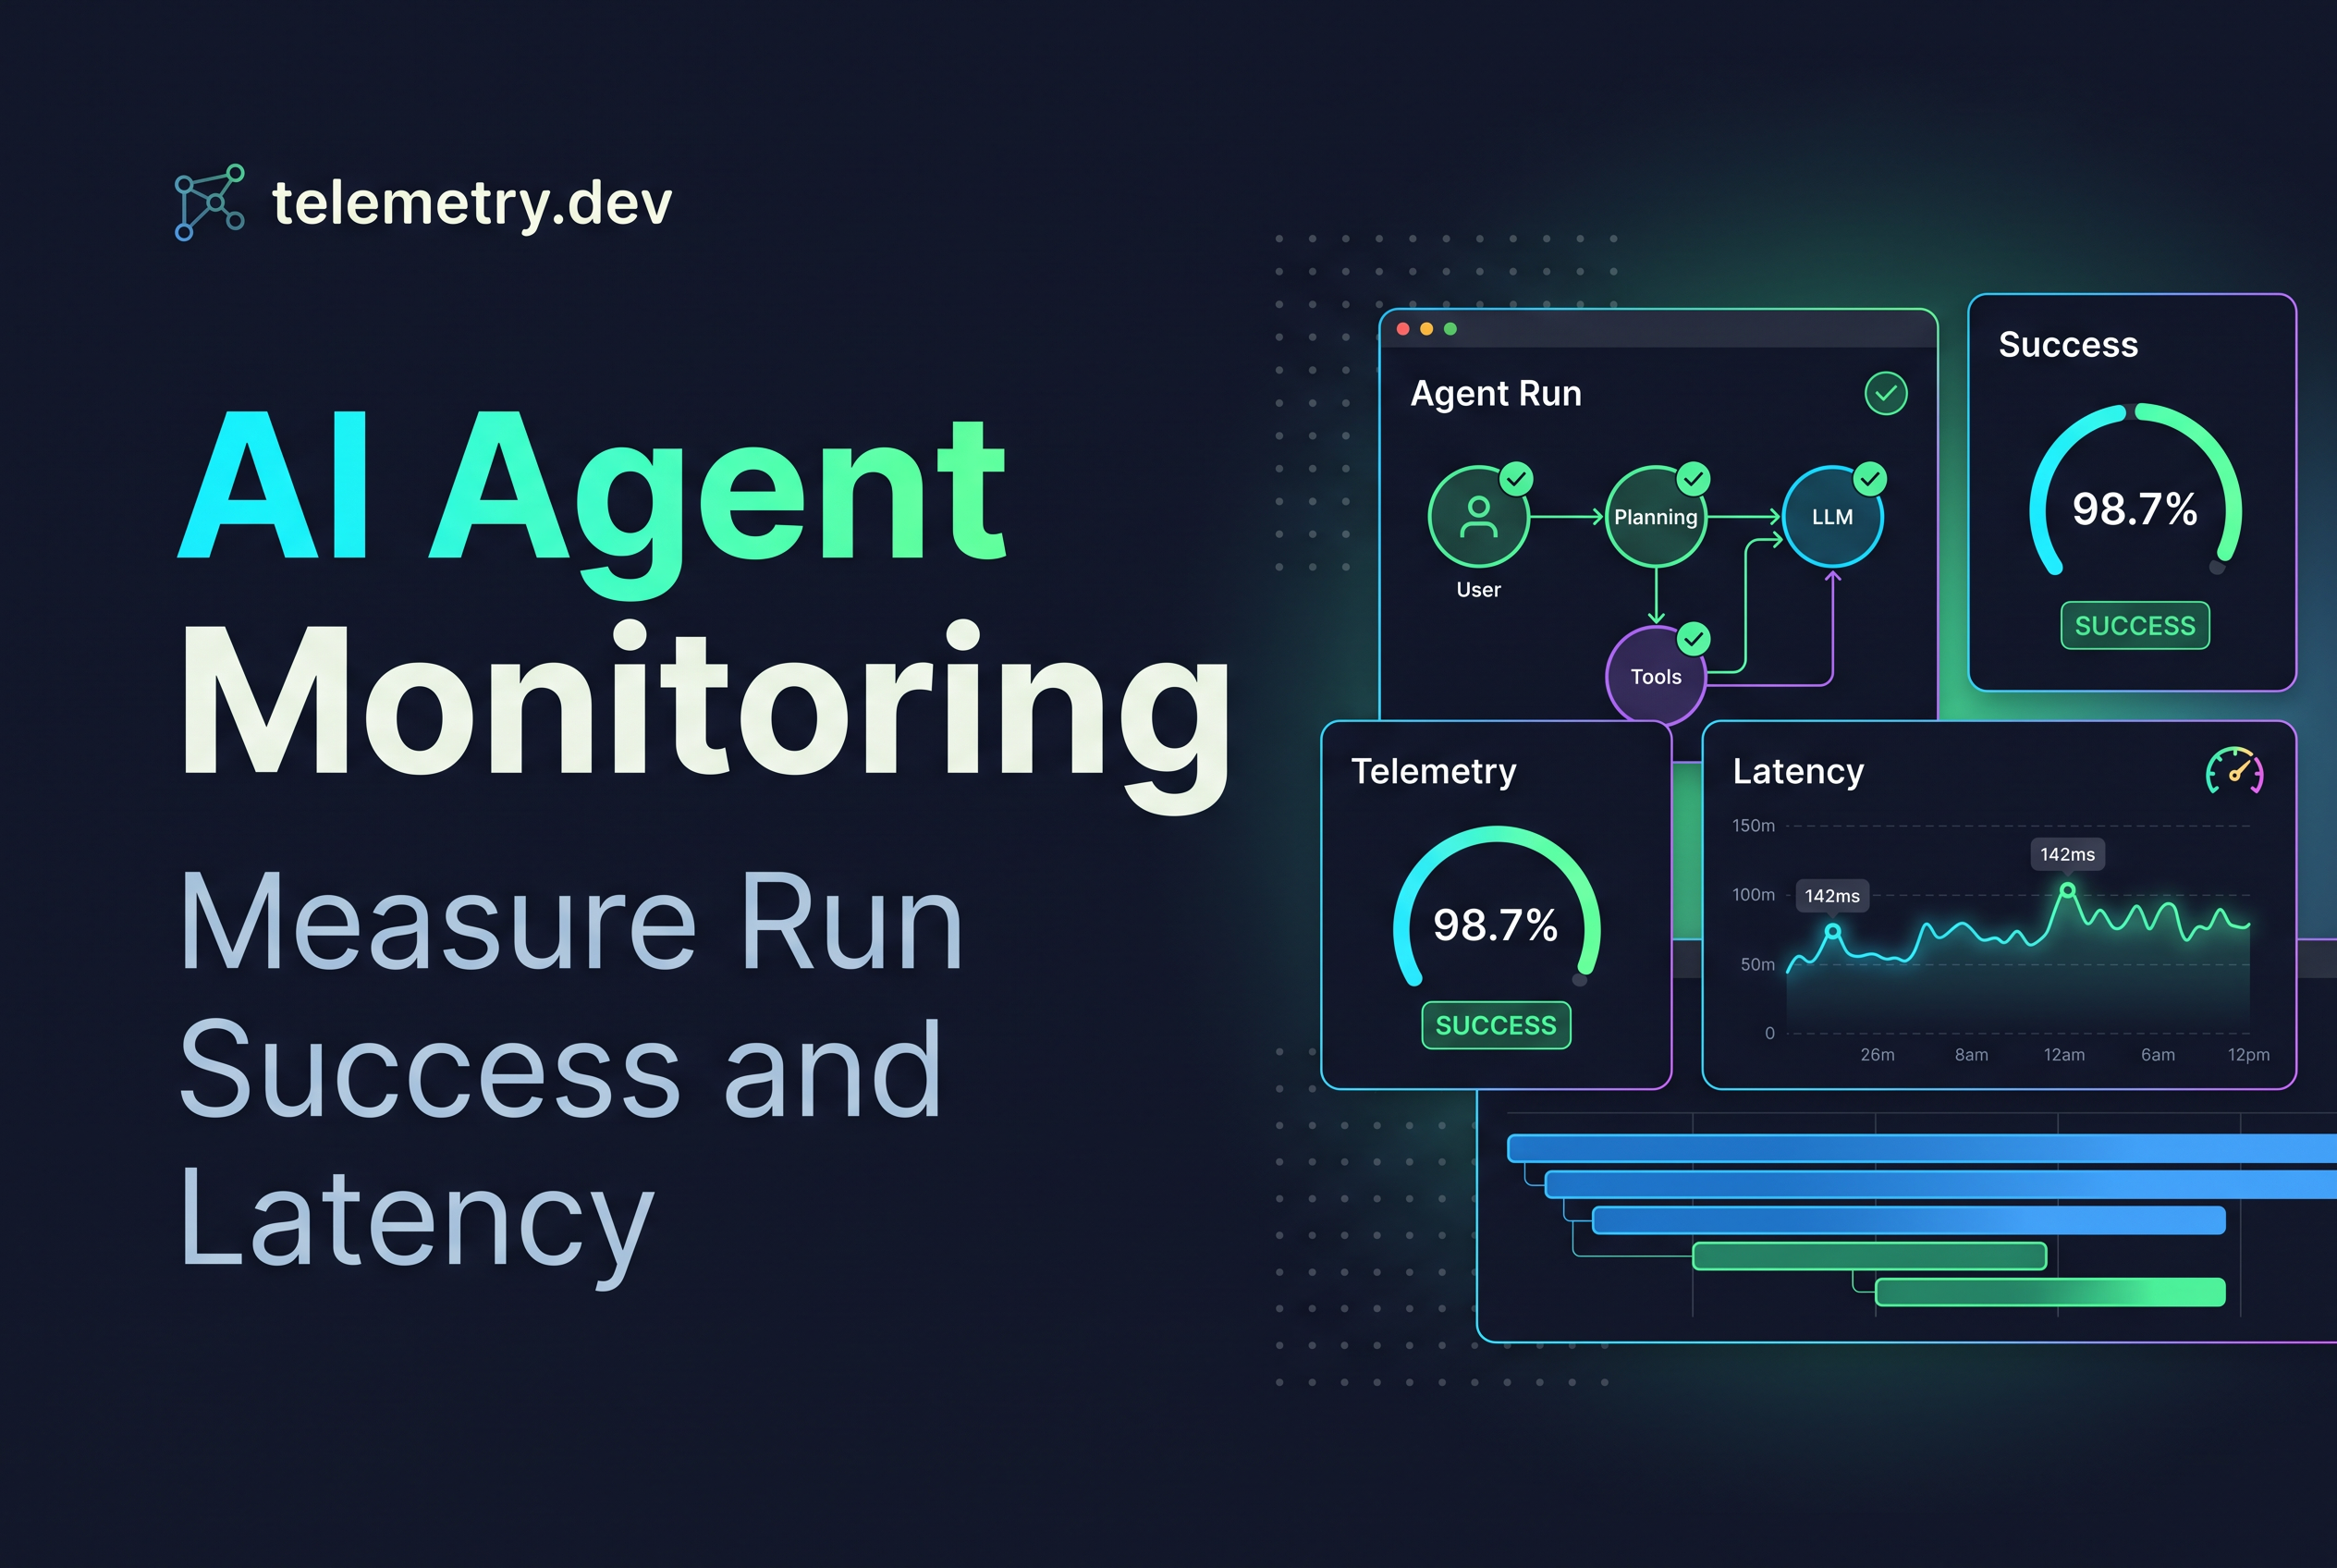
How this differs from our other guides: LLM Tracing: Fix Async Parent and Child Span Links is in-process async. LiteLLM Tracing: Correlate App and Gateway Requests is gateway request correlation. OpenTelemetry LLM Observability: Verify Exported Spans is exporter verification. AI Agent Monitoring: Measure Run Success and Latency is run-level success metrics. This post is only the durable queue between enqueue and worker.
What are the best practices for monitoring generative AI jobs?
Keep one trace from enqueue to finish, so queue wait and processing time sit on the same timeline. Then instrument each model call, tool step and retrieval as its own span, and record tokens, latency and errors on each. Send only allowlisted message metadata, and keep prompts and payloads out unless you need them. Treat cost as an estimate: it depends on reported token usage and a pricing match, so missing instrumentation means missing numbers.
Which frameworks can monitor AI models and agents?
OpenTelemetry is the common base. It gives you one trace format that any backend can read, so you are not locked to a single vendor. On top of it you add instrumentation for your model provider or framework, such as the OpenAI, Anthropic, Vercel AI SDK or LangChain/LangGraph integrations. telemetry.dev accepts standard OTLP/HTTP and has first-party TypeScript and Python SDKs. An integration existing doesn't mean every framework event is captured, so check which spans appear before you rely on them.
What does generative AI monitoring need to cover in 2026?
The same basics apply as before, but agents make them harder because work is spread across queues, workers, tools and retries. Good monitoring now has to follow a single job across those boundaries and show where time and spend went. That means context propagation through the queue, spans for every model and tool step, and cost and token data tied to the run that caused them. Standard OpenTelemetry instrumentation keeps this portable as models and frameworks change.
Carry the context yourself, then check one job end to end
Queues won't carry your trace for you, and no monitoring tool fixes that from the outside. Write the inject and extract functions, add the enqueue timestamp, and run one real agent job through your queue. Then send the worker's spans to telemetry.dev over OTLP using the free plan (30k units) and confirm that one trace shows enqueue, queue wait and processing with the model and tool spans nested inside.
Share this article