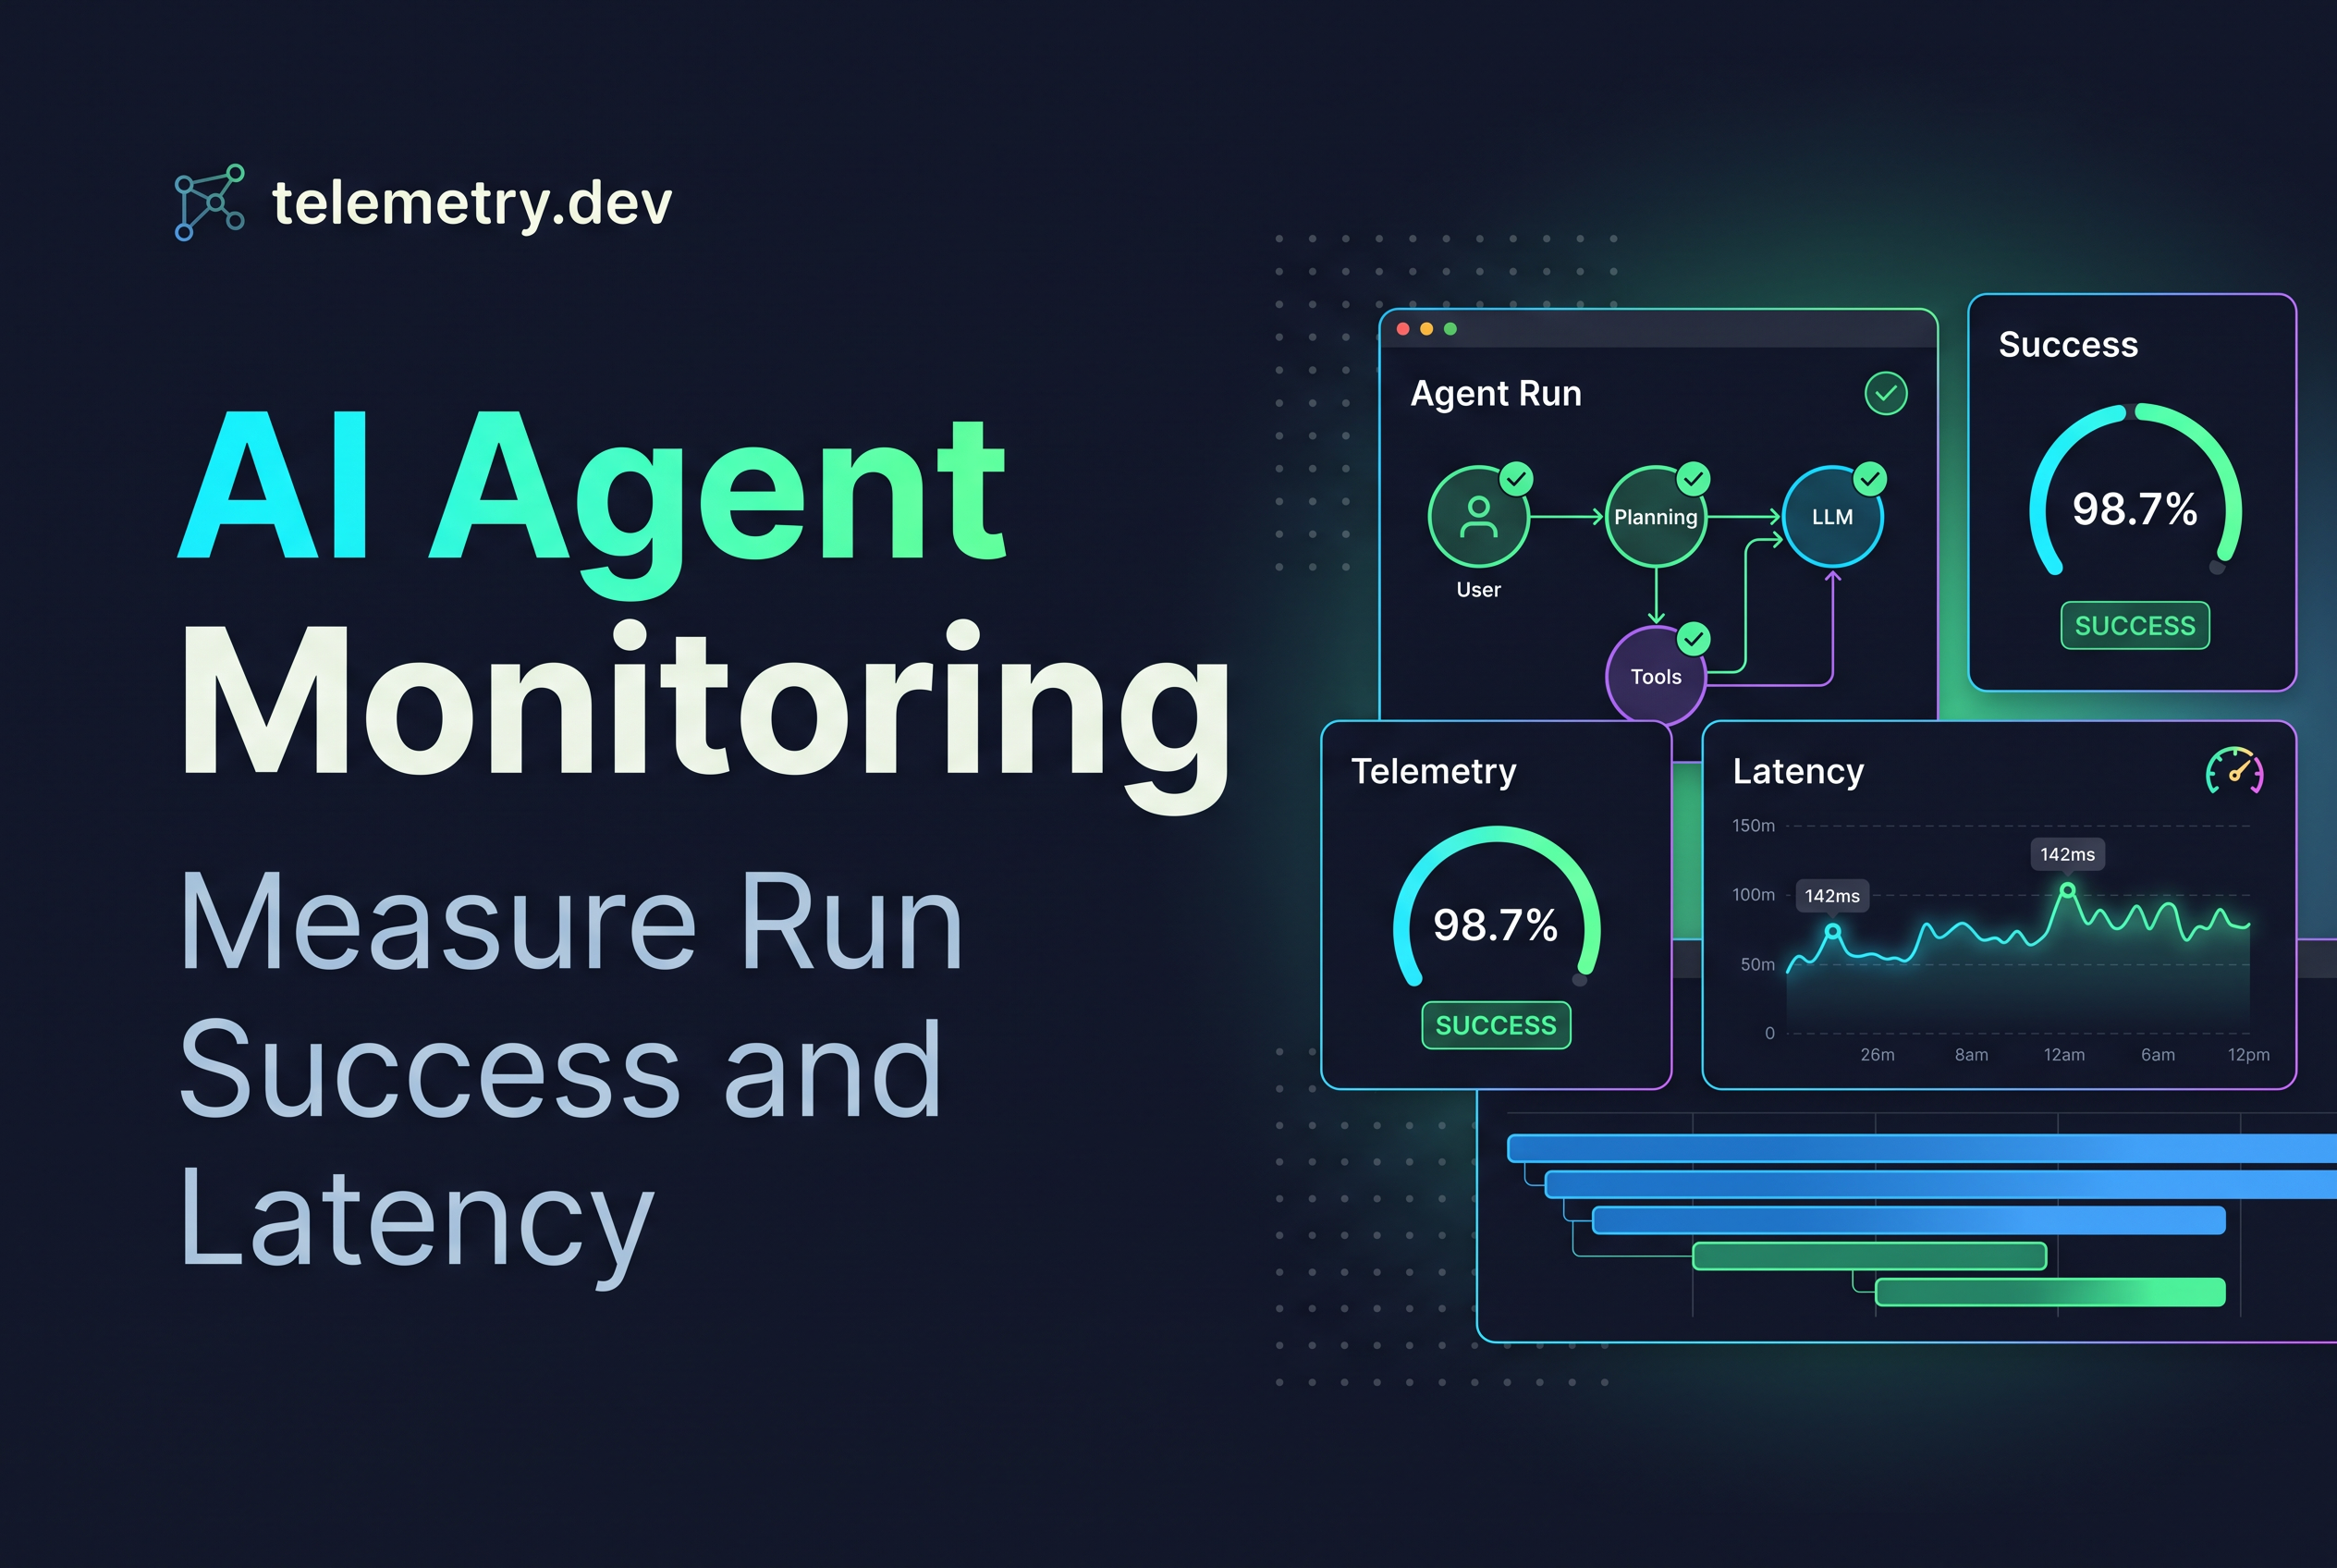
AI agent monitoring is the practice of measuring whether each agent run actually finished its job, and how long it took, so you can answer "what percent of runs complete, and how fast?" with numbers instead of a hunch. The unit is the run, not the HTTP request and not the single model call.
Most small teams can't answer that question today. They have logs showing 200 responses and a provider dashboard showing token spend, and they assume the agent is fine until a user complains. This post gives you a run-level measurement plan: define success inside your application, choose your denominators before you compute a rate, report p50 and p95 run duration, and drill from a bad number into the trace. It deliberately stops short of alerting, evals and quality scoring.
What AI agent monitoring is (and how it differs from observability)
AI agent monitoring is tracking a small set of run-level numbers over time: how many runs started, how many completed, and how long they took. It tells you whether the agent is healthy right now and whether it got better or worse after a change.
AI agent observability versus monitoring is a question of direction. Monitoring starts from a number you chose in advance (completion rate, p95 duration) and tells you something is off. Observability lets you ask a question you didn't plan for, such as "why did this one run take 90 seconds?", by inspecting the underlying traces, tool calls and model calls. You need both, in order. The number tells you where to look, and the trace tells you why.
That ordering is the whole plan in this post. Pick the numbers first. Keep the traces so you can explain them.
This is also why "AI agent analytics" and "AI agent behavior analysis" searches tend to disappoint. They promise insight into what the agent did, but without a defined success event and a denominator you only have a pile of spans. Start with the measurement, then analyze behavior inside the runs that missed it.
A 200 OK is not a completed run: define success in your application
A 200 OK means your server answered. It doesn't mean the agent finished the work. An agent endpoint can return 200 while the run ended because it hit a step limit, a tool call failed three times, the model returned an empty plan, or the user got a polite apology instead of a result.
Only your application knows what "done" means, so you have to define it. Write the definition down per agent, in terms of an outcome you can check in code:
A support agent: a reply was sent and a ticket status moved to resolved or escalated.
A research agent: a report was saved with at least one cited source.
A coding agent: a patch was produced and applied without a tool error.
Then make the run emit one explicit outcome when it ends: success, failed, or abandoned (timeout, step limit, user cancelled). Don't infer it later from HTTP status or from the absence of an exception. Your code sets the outcome at the point where it knows.
This definition is yours and it will be imperfect. That's fine. A crude, consistent definition you can trend beats a clever one you can't reproduce. If the definition changes, note the date, because your success rate before and after are no longer comparable.
Pick metric denominators before you compute a success rate
A success rate is only as honest as its denominator, so choose it before you look at the number. "95% success" can mean 95% of all started runs, 95% of runs that reached a terminal state, or 95% of runs that weren't user-cancelled. Those can differ by ten points on the same data.
Use this default and change it on purpose, not by accident:
Numerator: runs whose application-set outcome is success.
Denominator: all runs that started in the window, including ones still in flight once they are older than your timeout.
Exclusions you state explicitly: internal test traffic, runs cancelled by the user before the first step, and replays.
Count runs that never emitted an outcome as failures or as "unknown", and report unknown as its own number. A growing unknown bucket is a signal in itself. It usually means a crash, a killed process or a missing instrumentation path, and it hides inside a success rate that quietly drops those runs from the denominator.
Slice by agent, version and tenant only after the top-level number is stable. A rate computed on 12 runs is noise. Report the count next to every rate so nobody over-reads a small sample.
Measure p50 and p95 run duration, not average latency
Report p50 and p95 of run duration, because the average hides exactly the runs that hurt. Agent runs are long-tailed. Most finish in a few seconds, and a few loop through tools and retries for a minute or more. One 120-second run among 99 runs of 4 seconds moves the mean to about 5 seconds. In that example p95 is still 4 seconds, so inspect maximum duration and slow-run counts alongside percentiles to catch rare outliers.
Measure from run start to the moment your application sets the outcome, not from the first model call. Users wait for the whole run, including tool calls, retrieval and retries.
Track duration three ways:
All runs: the number users feel.
Successful runs only: your real best case. If p50 here is fine but the all-runs p95 is bad, failures and timeouts are the problem, not slowness.
Failed runs only: how long you spend before giving up. Long failures burn user patience and tokens for nothing.
Watch p95 more than p50 for regressions. A prompt change or a new tool usually moves the tail first. For what retries and tool failures do to that tail, see Agent Telemetry: Trace Retries and Tool Failures. For tying spend to the same runs, see AI Cost Observability: Trace Spend to Agent Runs.
Emit run-level signals with OpenTelemetry and send them to telemetry.dev
Make each agent run one root span, put the outcome on it as an attribute, and let model calls and tool steps be child spans. Then run duration is the root span's duration, and success rate is a count over that attribute. You don't need a special agent framework.
telemetry.dev is LLM observability for AI apps and agents, built on OpenTelemetry, that traces model calls, tool steps and retrievals and tracks cost, latency, tokens and errors. It has first-party TypeScript and Python SDKs, and any OTLP/HTTP exporter or OpenTelemetry Collector works, so the instrumentation you write for run-level signals is standard OpenTelemetry.
The pattern in your own code looks like this (generic OpenTelemetry, with attribute names you choose):
await tracer.startActiveSpan("agent.run", async (span) => {
  span.setAttribute("agent.name", "support-agent");
  try {
    const result = await runAgent(input);
    span.setAttribute("run.outcome", result.done ? "success" : "failed");
  } catch (e) {
    span.setAttribute("run.outcome", "failed");
    span.recordException(e as Error);
  } finally {
    span.end();
  }
});
Set run.outcome in every exit path, including timeouts and step limits, so nothing ends without one. Mark generative AI spans with genai.operation.name (for example chat or executetool) so model and tool steps are recognizable inside the run. If you use LiteLLM as a gateway, LiteLLM Tracing: Correlate App and Gateway Requests shows how to keep one run connected across hops.
Drill from a bad number into the trace: find the slow step, inspect the failed call
When p95 jumps or the success rate dips, open the traces for the runs in the bad bucket and find the slow step or the failed call. That's the payoff of putting the run on a root span. The number and the explanation live in the same data.
A practical drill-down order:
Filter to runs with a failed or unknown outcome in the window where the rate dropped.
Sort those by duration. The longest failures usually share one cause.
Open the slowest trace and read the child spans top to bottom. Look for one tool call that dominates the time, a model call repeated many times, or a retry chain.
Inspect the failed call itself: the error, the tool arguments, the model response. That tells you whether to fix a prompt, a timeout or a downstream API.
Check one successful run from the same period for contrast. If the shapes match, the cause is elsewhere.
Know what the trace can show you. You get the detail your instrumentation emits, so missing spans mean missing evidence. Prompt and output capture can include sensitive text, so decide per environment what you capture. OpenTelemetry GenAI Prompt Capture: Inspect Before Export covers checking that before data leaves your app.
The habit to build is simple. No number without a trace behind it. Every time someone quotes a success rate or a p95, you should be one click from an example.
What this setup does not cover: alerting, evals and quality scoring
This plan measures whether runs finish and how long they take. It doesn't tell you whether the answers were good, and it doesn't page anyone.
Three things sit outside it:
Alerting: you'll check the numbers on a schedule or build your own notification from them. The measurement plan is a prerequisite for alerts, not a substitute.
Evals: a run can be marked success by your definition and still be wrong. Judging correctness needs test sets or reviewers, which are a separate practice.
Quality scoring: helpfulness, tone and factuality aren't captured by an outcome attribute.
telemetry.dev doesn't do evaluations or prompt management. It gives you traces, latency, cost, tokens and errors for the runs you instrument. That's the right foundation for AI performance tracking, and it keeps the first question answerable: what percent of runs finish, and how long do they take?
On tooling, the category is crowded. Roundups of agent observability tools list LangSmith, Langfuse, Arize, Braintrust, Helicone and others, many bundling evals and prompt workflows. Pick by the job. If you need evals in the same product, that narrows the field. If you need run-level traces and cost on OpenTelemetry at a flat per-workspace price (Free $0, Pro $25/month, Team $50/month), that's where telemetry.dev fits.
Instrument one run this week and read the p95
You don't need a monitoring platform to start. You need one root span per run, an outcome attribute your code sets, and a denominator you wrote down. Pick your busiest agent, add that span, and send it through the OpenTelemetry setup in the telemetry.dev docs on the free plan. After a day of traffic, read the success rate with its run count, read p50 and p95, and open the slowest failed trace. That one pass will tell you more than another month of 200 OK logs.
Share this article