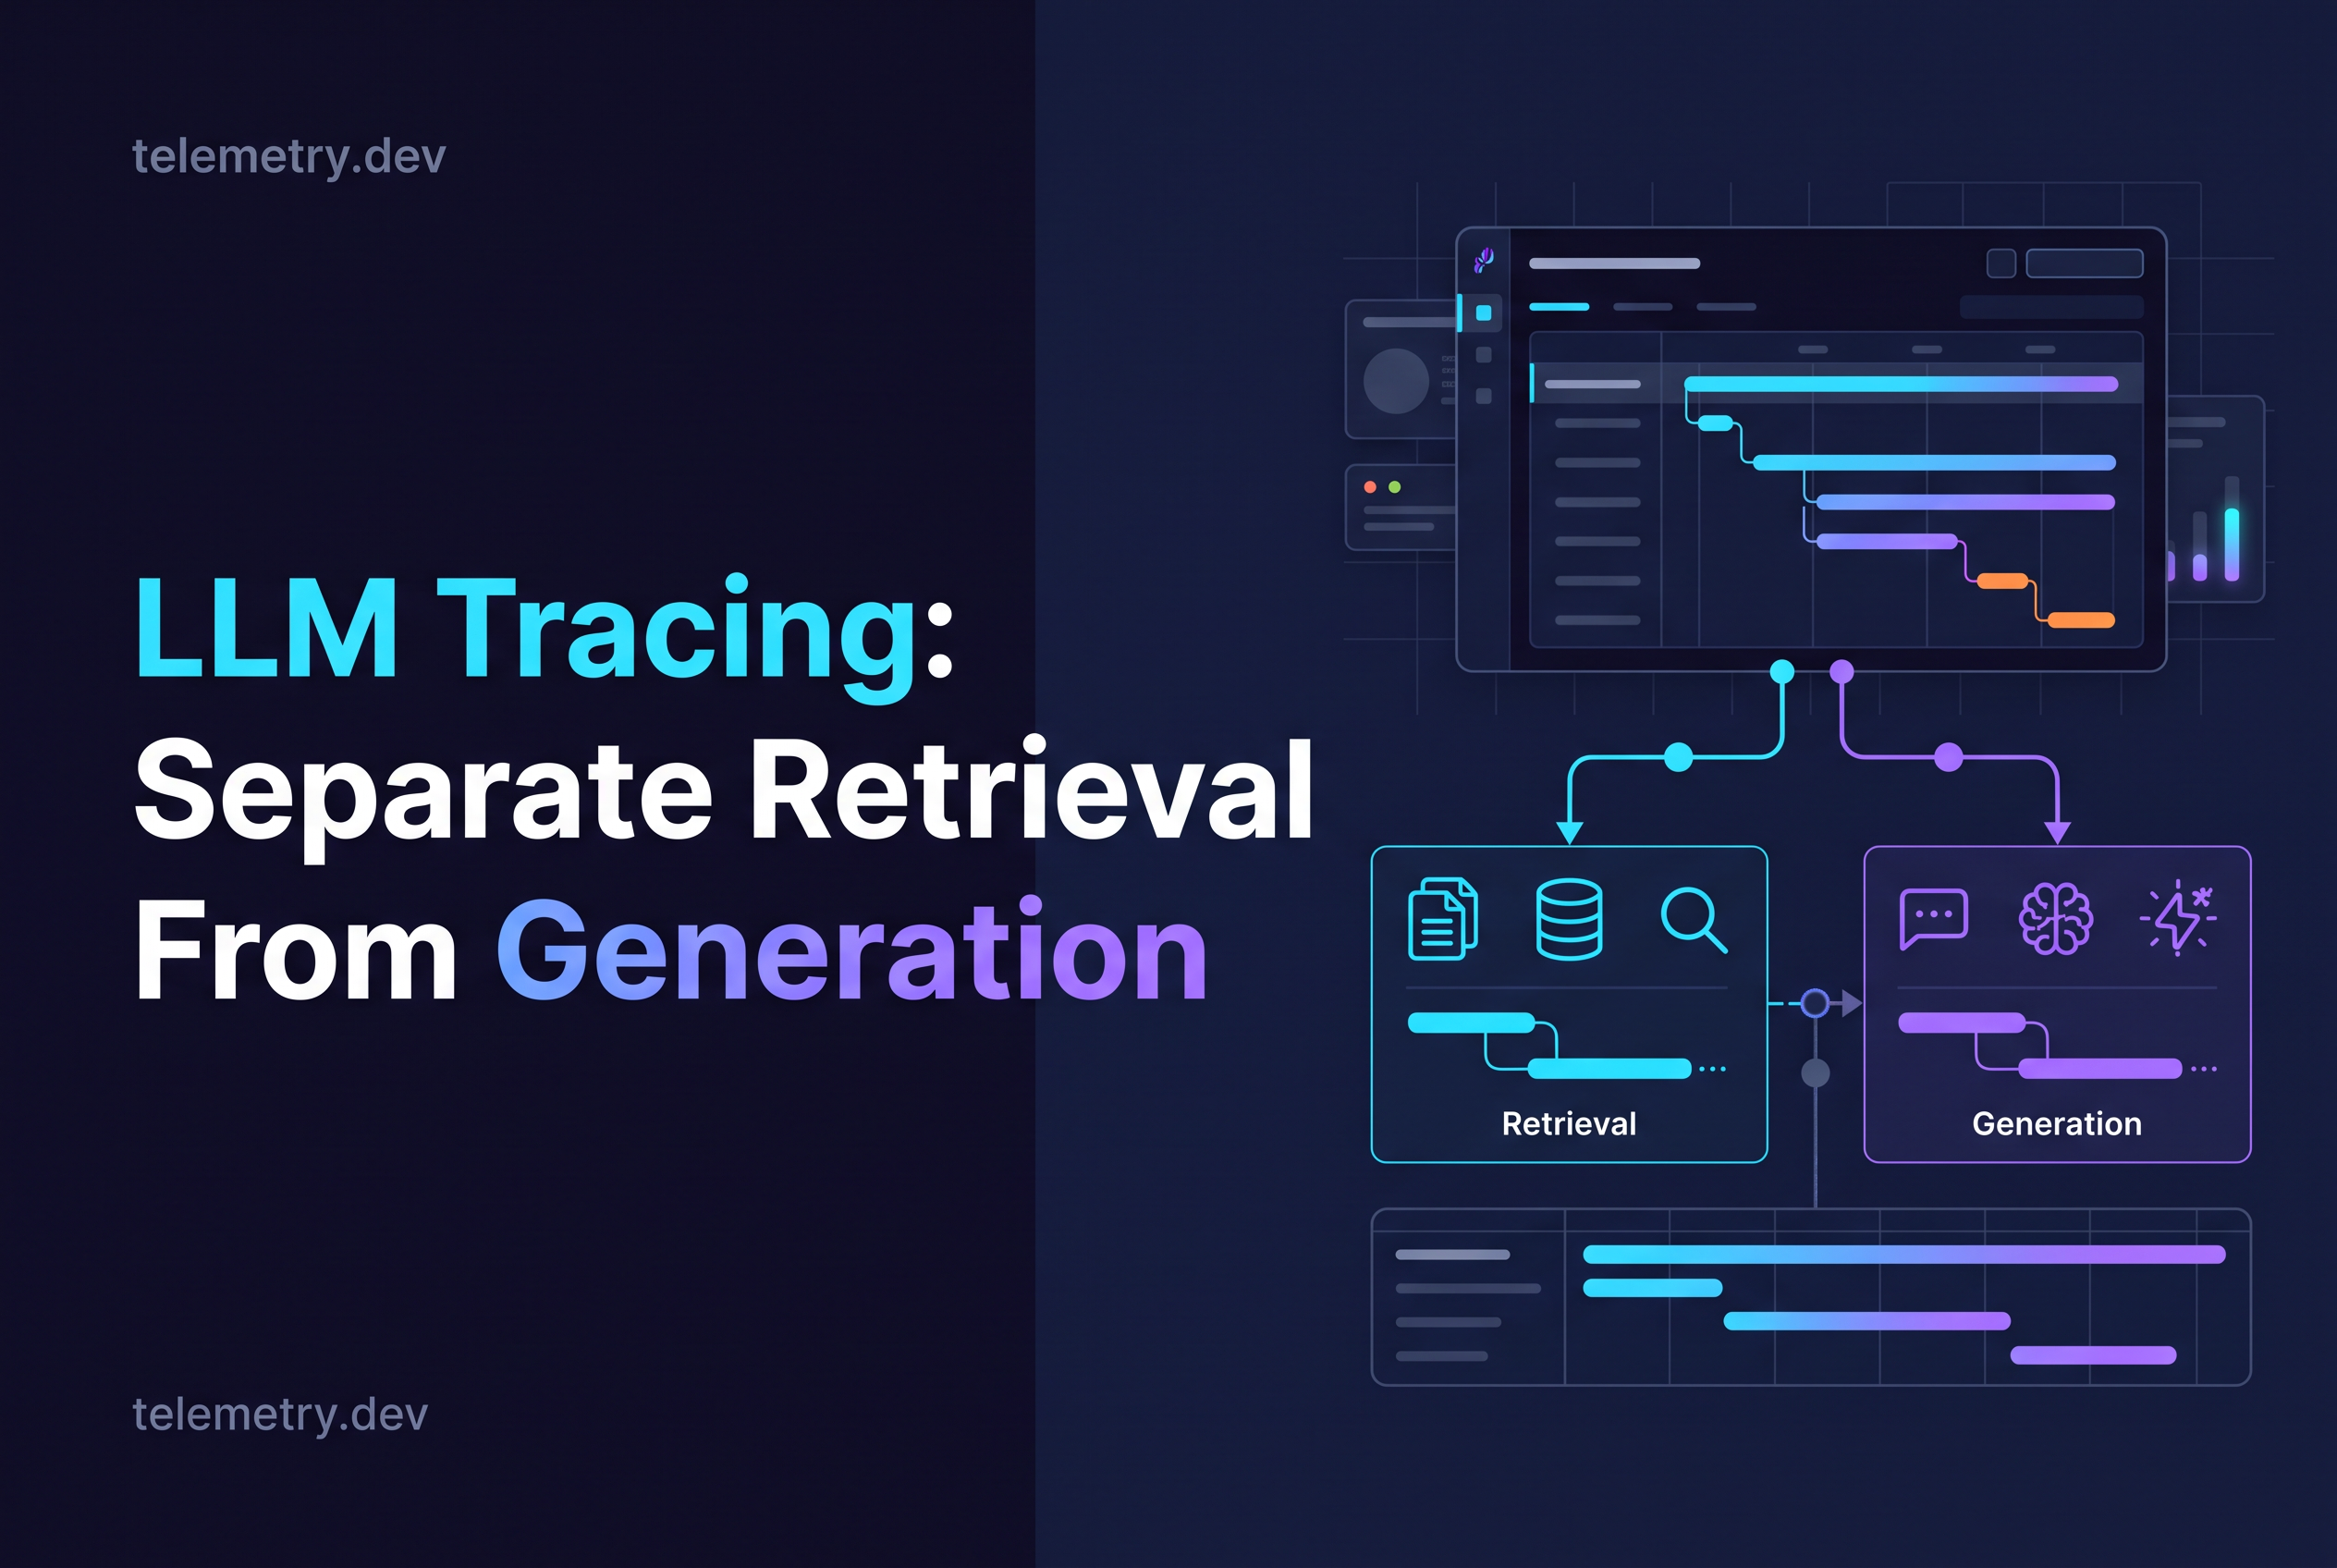
LLM tracing for a RAG request means recording retrieval, reranking and generation as three separate spans under one parent, so a slow or wrong answer points at one step instead of the whole request. A single span around the whole handler tells you the request took 6.2 seconds. It doesn't tell you whether the vector store, the reranker or the model provider ate those seconds.
This post is code-first. You will instrument a RAG request you own in Python, record safe retrieval metadata, name the spans with OpenTelemetry GenAI conventions, and learn four trace shapes that point at the slow step. It also says plainly what a trace can't tell you: whether the retrieved chunks were any good.
Why one slow RAG request needs three spans, not one
One span per request hides the only question you care about: which step was slow. A RAG request has at least three distinct operations with different failure modes. Retrieval queries an index and can be slow because of a cold cache, a large top_k or an overloaded store. Reranking scores a candidate list and scales with how many candidates you pass in. Generation calls a model provider and scales with prompt size, output length and provider load.
Put all three in one span and you get a single number. Put them in three sibling spans under a parent and you get a breakdown. Sibling matters: retrieval, reranking and generation each start and end inside the request span, and none is the parent of another. The parent owns the total. The children own the parts.
That structure is also the answer to "LLM tracing vs logging". A log line says something happened. A trace records that retrieval started at t+12ms, ended at t+410ms, and that generation began only after reranking finished. Parent and child relationships and durations are the point, and log lines don't carry them. The same shape applies to agents: model calls, tool executions and retrievals become spans in one tree. For a trace, span and thread primer, see Confident AI's explainer and Comet's overview.
Retriever execution time versus provider-call time
Retriever execution time is the wall-clock duration of your own code querying your own index. Provider-call time is the duration of an HTTP round trip to a model provider you don't control. Treat them as different budgets, because you fix them in different places.
If retrieval is slow, you tune the index, the filter, the embedding call or the network path to your store. If generation is slow, you shorten the prompt, cap output tokens, stream, switch models or add a timeout and fallback. Mix the two into one latency number and you'll chase the wrong fix.
One trap: the embedding call that turns the query into a vector is usually a provider call too. Decide up front whether it lives inside the retrieval span or gets its own child. Leave it inside, and a slow embedding provider will look like a slow vector store. Give it its own child span under retrieval when you suspect that, and the two separate cleanly.
The same rule applies to the span that wraps your provider call. Time only the call, not your prompt assembly. Build the prompt before you open the generation span, so the duration reflects the provider and not your string formatting.
Instrument retrieval, reranking and generation in Python
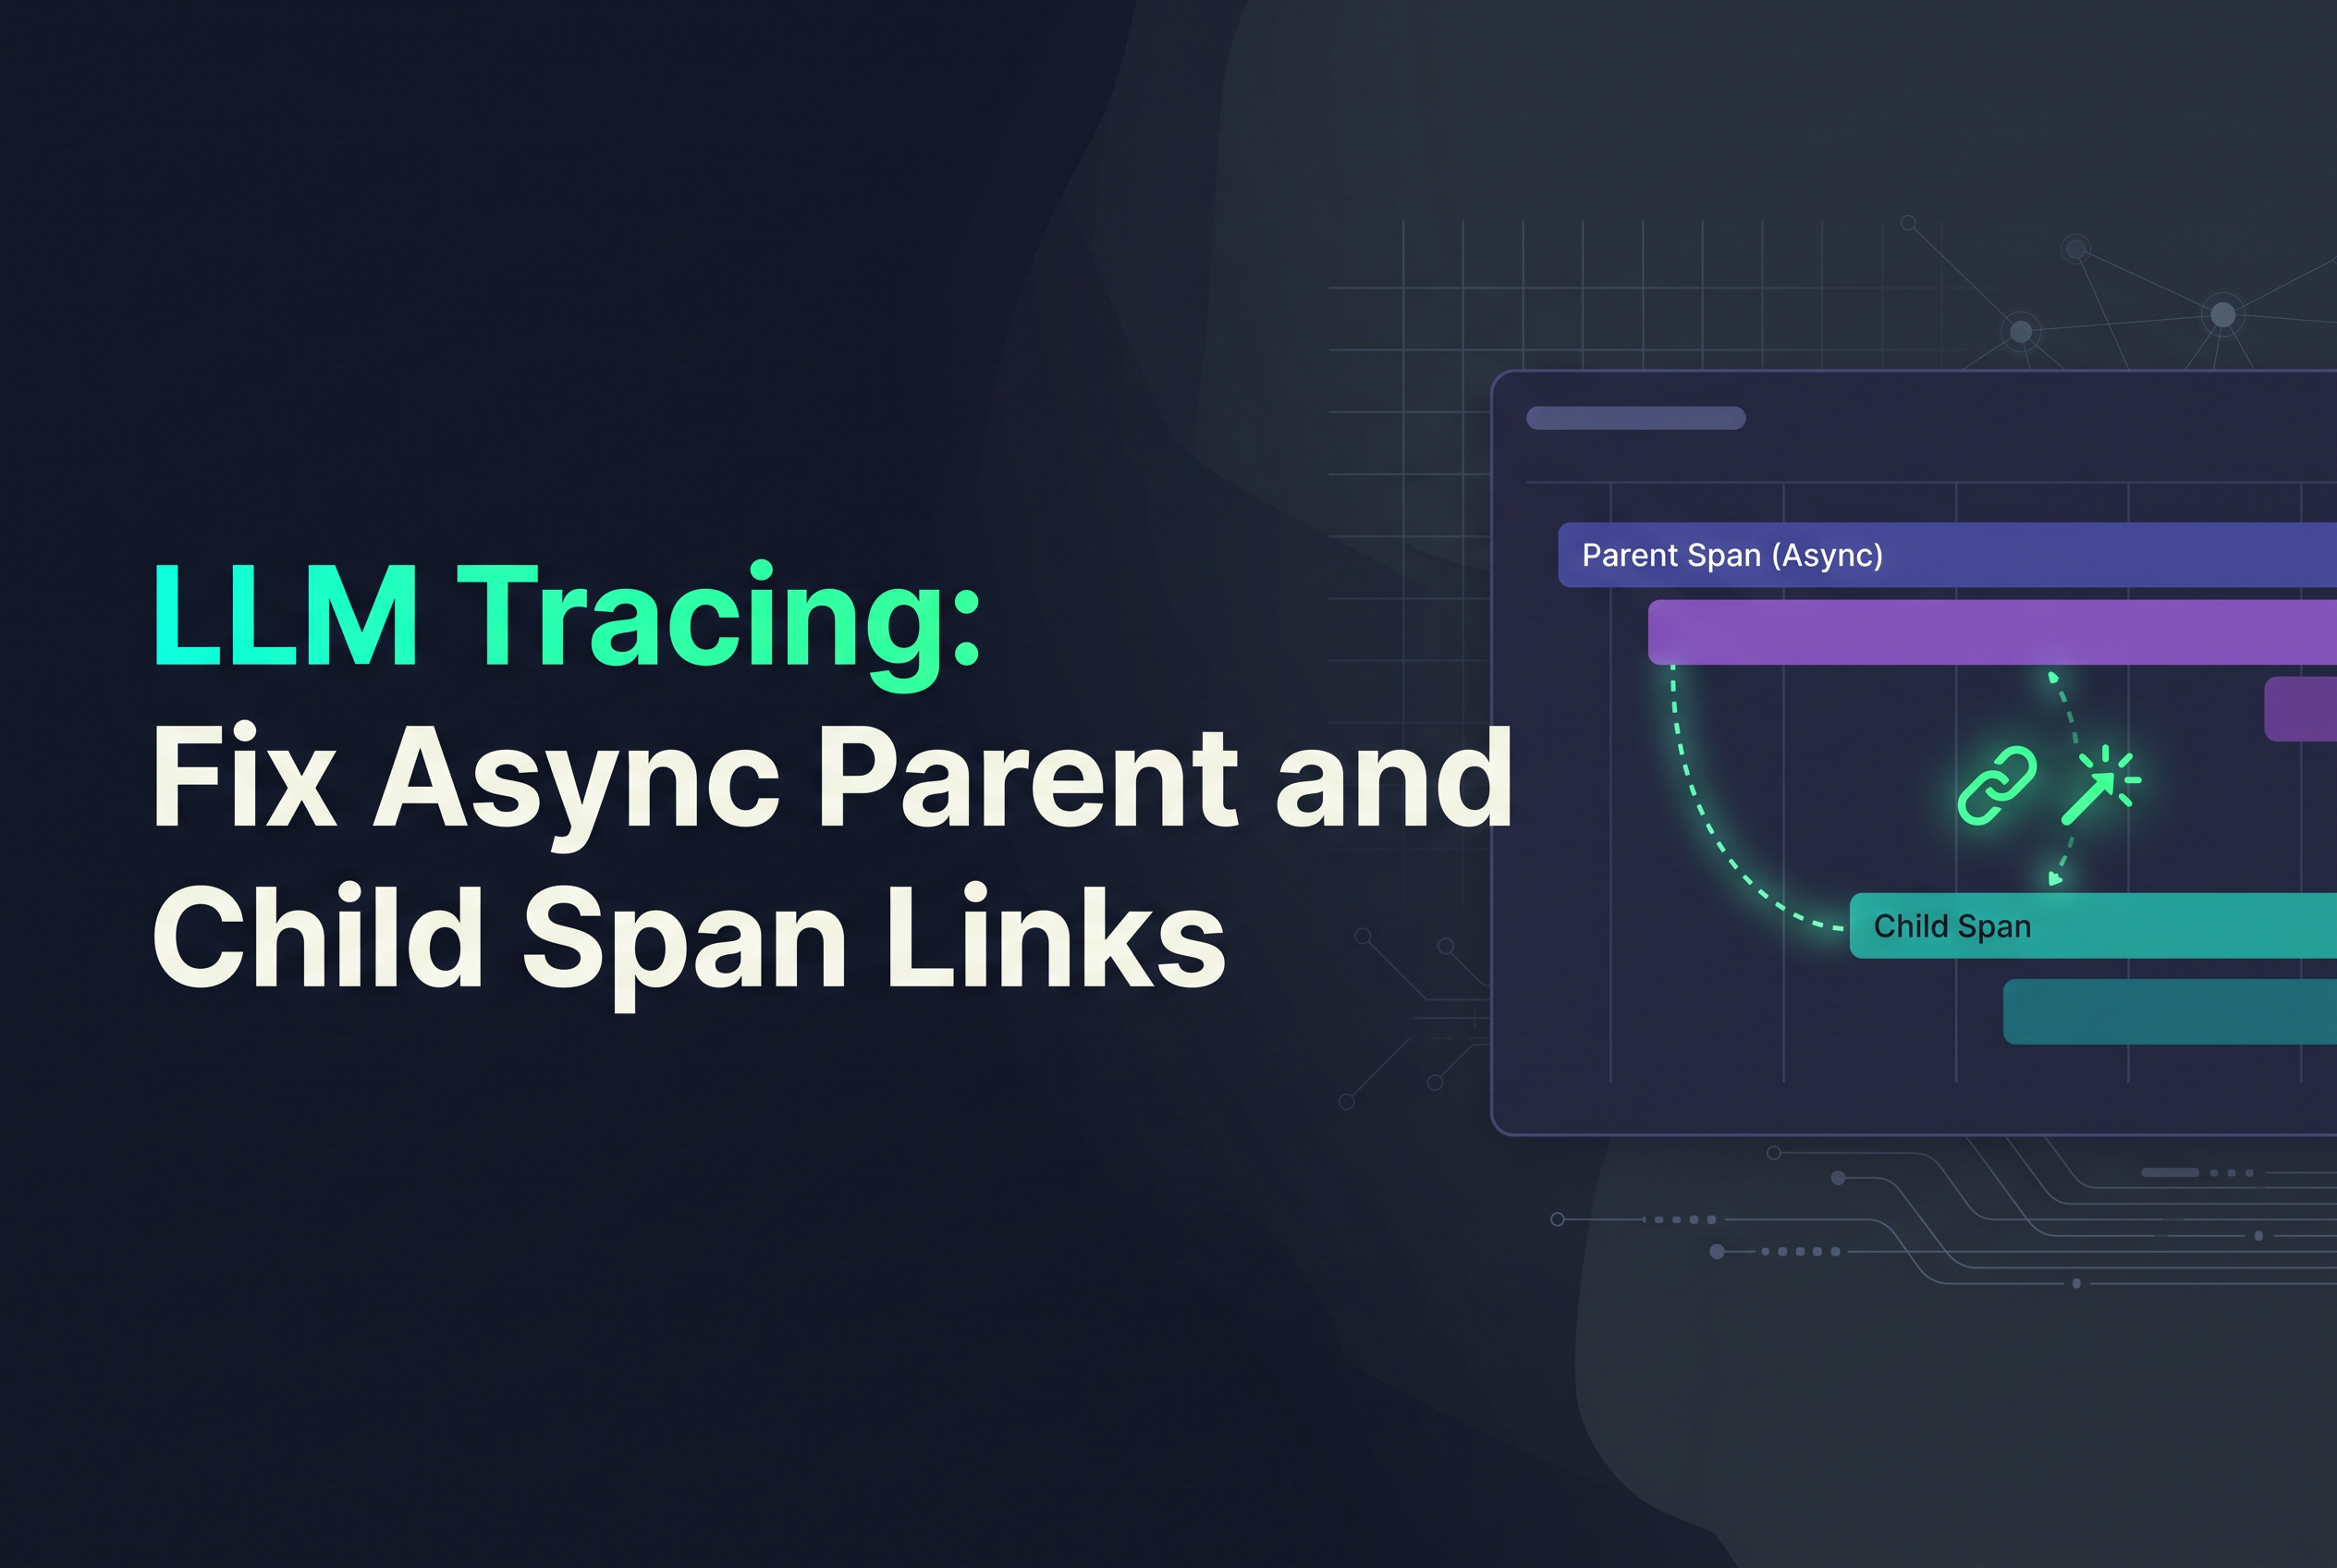
Use the OpenTelemetry manual instrumentation API: get a tracer, open a parent span, and open each step as a child with start_as_current_span. Inside async functions, use the plain synchronous with tracer.start_as_current_span(...) form. It works fine in a coroutine as long as you don't hold the span open across a task boundary. If you do need to carry context into background tasks or queues, see Fix Async Parent and Child Span Links.
from opentelemetry import trace

tracer = trace.get_tracer("rag.service")

async def answer(question: str) -> str:
    with tracer.start_as_current_span("rag.request") as request_span:
        request_span.set_attribute("rag.question_chars", len(question))

        with tracer.start_as_current_span("retrieval docs_index") as r:
            r.set_attribute("gen_ai.operation.name", "retrieval")
            r.set_attribute("gen_ai.data_source.id", "docs_index")
            r.set_attribute("gen_ai.retrieval.top_k", 20)
            candidates = await vector_store.search(question, top_k=20)
            r.set_attribute("rag.candidates_returned", len(candidates))

        with tracer.start_as_current_span("rerank") as rr:
            rr.set_attribute("rag.candidates_in", len(candidates))
            top = await reranker.rank(question, candidates, keep=5)
            rr.set_attribute("rag.candidates_kept", len(top))
            rr.set_attribute("rag.doc_ids", [d.id for d in top])

        prompt = build_prompt(question, top)

        with tracer.start_as_current_span("chat gpt-4o") as g:
            g.set_attribute("gen_ai.operation.name", "chat")
            g.set_attribute("gen_ai.request.model", "gpt-4o")
            reply = await provider.chat(prompt)
            return reply.text
Three things to notice. The three step spans are siblings, each opened inside the request span and closed before the next starts. The prompt is built between the rerank and generation spans, so it counts toward neither. And each span records counts on the way out, so duration and size sit on the same row.
If you already export OpenTelemetry spans, telemetry.dev (LLM observability built on OpenTelemetry) accepts them through a span processor or a standard OTLP/HTTP exporter. For a TypeScript stack, the Vercel AI SDK tracing guide covers the equivalent setup.
What to record on a retrieval span: safe metadata and what to leave out
Record sizes, ids and configuration on a retrieval span, and leave out raw text. Safe and useful: top_k, the number of candidates returned, the number kept after reranking, the data source id, an index or collection name, and document ids. Counts and ids let you answer "did this request return zero results" and "which documents reached the prompt" without copying content into your telemetry.
Leave out by default: the raw query text, the retrieved chunk bodies, and any metadata fields that carry user data such as emails, account ids or file paths. The OpenTelemetry GenAI conventions treat the retrieval query and returned documents as opt-in attributes for a reason. They are the likeliest place for personal or confidential data to leak into a trace. Add them deliberately, in an environment where you have decided that's acceptable.
A practical rule: if you wouldn't paste the value into a public bug report, don't put it on a span. Use a hashed or internal document id instead, and keep the text in the store you already secure. In telemetry.dev, prompt capture can be turned off per environment before storage, and redaction patterns apply, but redaction can't catch all sensitive data. Filtering at the point of instrumentation is the only way to make sure a value never leaves your app. The longer version is in OpenTelemetry GenAI Prompt Capture: Inspect Before Export.
Name spans with OpenTelemetry GenAI conventions
Follow the GenAI semantic conventions so any backend recognizes your spans without custom mapping. For a retrieval client span, set gen_ai.operation.name to retrieval. When it applies, set gen_ai.data_source.id to the identifier of the data source, and name the span retrieval {data_source_id}. gen_ai.retrieval.top_k is a recommended attribute. Retrieval performed as a framework or application pipeline step may instead use a gen_ai.retrieval span named retrieval. The conventions have moved around, so check the current GenAI span conventions before you hard-code names.
For the model call, use gen_ai.operation.name of chat (or embeddings, execute_tool, invoke_agent where they fit), plus gen_ai.request.model. Reranking has no dedicated operation name in what we checked, so name it plainly (rerank) and keep your own attributes under a namespace you control, like rag.. Don't invent gen_ai. attributes that the spec doesn't define.
Consistent names pay off later. If every retrieval span is retrieval {data_source_id}, you can filter by data source and compare latency across indexes without regex over span names.
Read the trace: four patterns that point to the slow step
Once the three spans exist, four shapes cover most slow requests.
1. One fat retrieval span, small everything else. The store or the embedding step is the cost. Check top_k, filters and whether the embedding call is inside the span. Split the embedding into a child to confirm.
2. Rerank duration tracks candidates_in. Plot rerank duration against the candidate count. If they rise together, you're passing too many candidates. Lower top_k or cut the list before reranking.
3. Generation dominates and grows with prompt size. Provider time is the bottleneck. Compare input token counts across slow and fast requests, shorten the context you keep, cap output, or stream.
4. Total is long but the three children sum to much less. The gap lives in the parent: your own code between steps, a blocking call, or a queue wait. Look at what runs between spans, not inside them.
Before you trust any of this, check whether the slow requests are even in your data. If sampling drops them, your percentiles lie. See LLM Trace Sampling: Diagnose Missing Runs. To roll these per-step durations up into success rate and latency per run, use AI Agent Monitoring: Measure Run Success and Latency.
What a trace does not tell you about retrieval quality
A trace tells you how long retrieval took, how many items came back and which ids were used. It doesn't tell you whether those items were relevant or whether the answer was correct. A retrieval span that returns 5 documents in 40ms looks identical whether the 5 documents are perfect or irrelevant.
That's a limit of tracing, not a flaw in your setup. Quality needs a separate method: labeled queries, a relevance judgment you trust, or human review of sampled answers. Use the trace to decide where to look, then use an evaluation process to decide whether what you find is good.
The two work together. If users report wrong answers and your trace shows retrieval returned zero candidates, you've found a retrieval bug without scoring anything. If candidates came back and generation was fast, the problem is more likely content or prompting, and the trace has told you to go read the documents, not tune the store.
Open three sibling spans on your next RAG request
Stop timing the whole handler. Wrap retrieval, reranking and generation as three siblings under one request span, record counts and ids instead of text, and use the GenAI attribute names so any backend can read them. Then send the spans to telemetry.dev through the OpenTelemetry span processor or an OTLP/HTTP exporter and look at which of the three is slow. The Free plan includes 30k ingestion units, which is enough to trace a real RAG route this week.
Share this article