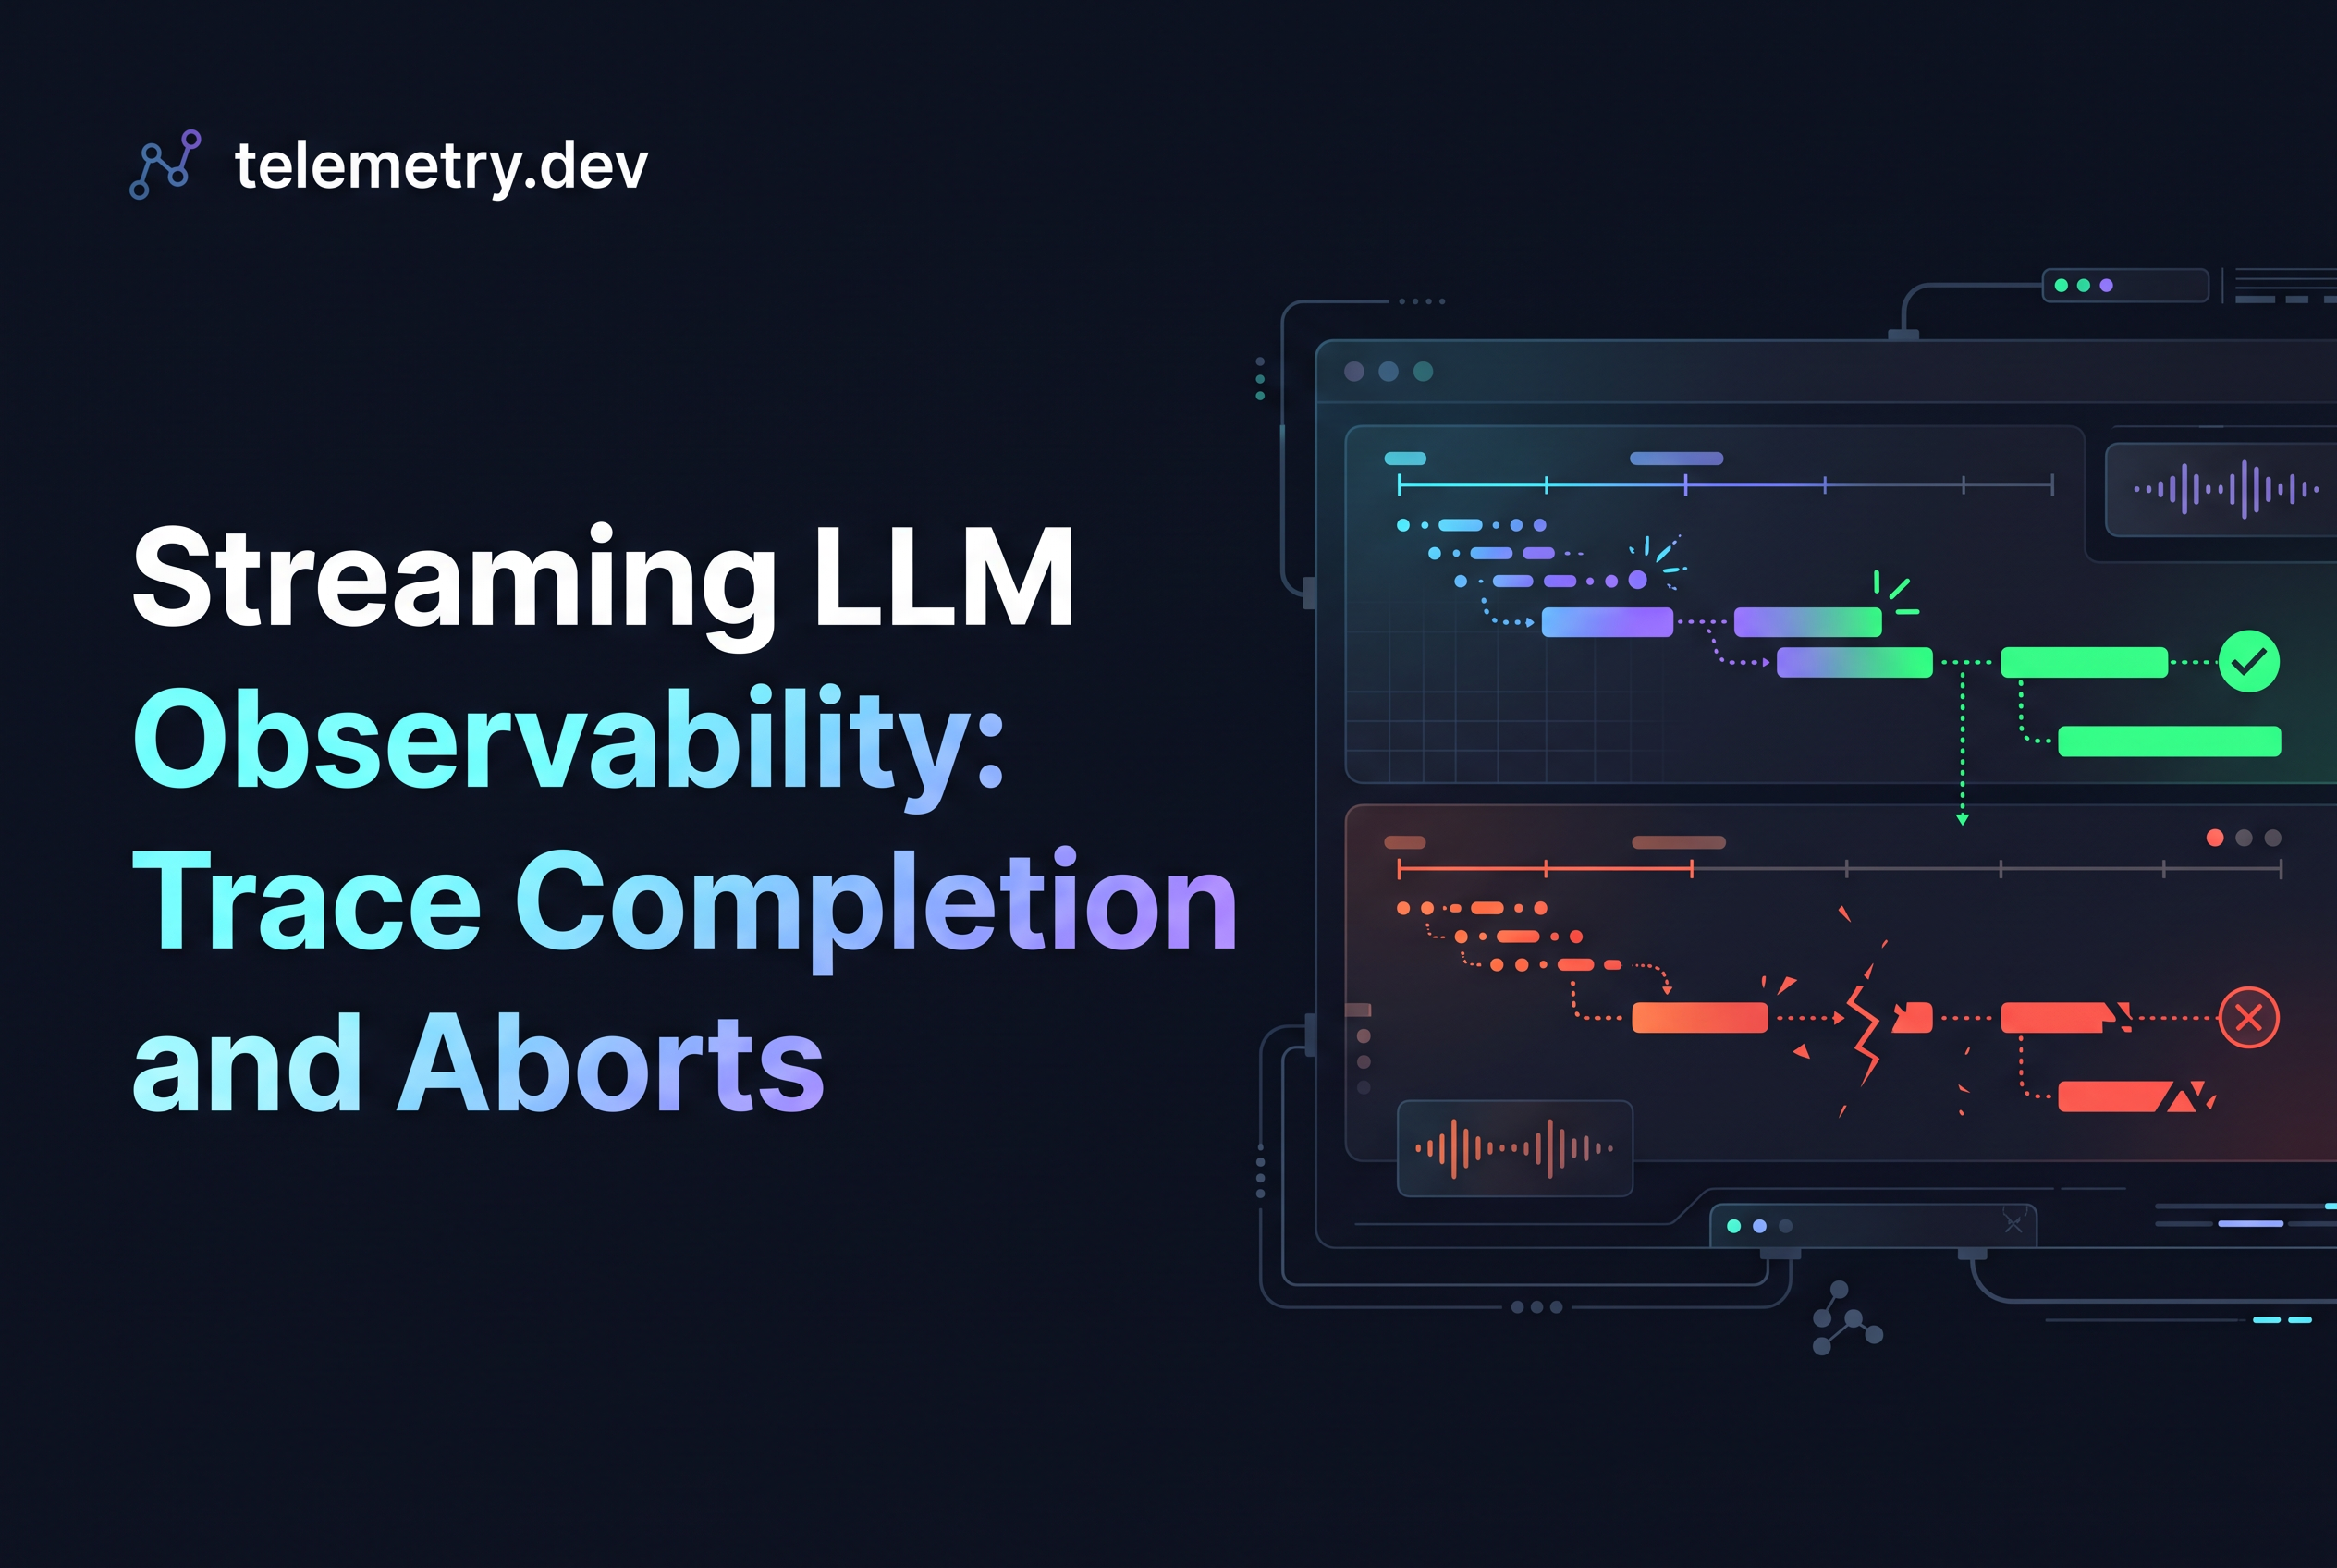
Streaming LLM observability means recording the lifecycle of a streamed response (request start, first meaningful output, last output, and a terminal completed, cancelled or failed state) instead of a single request-duration number. You can do it with plain OpenTelemetry and no special SDK.
A single duration span tells you a response took 41 seconds. It doesn't tell you whether the user stared at a blank screen for 38 of them, whether the stream stalled halfway, or whether they closed the tab and your server kept paying for tokens nobody read. This post covers the four timestamps and three end states worth recording, how to model them as one span with events, and how to wire it into a Vercel AI SDK streamText route. It also covers the trap most teams fall into: treating a browser disconnect as proof the upstream call stopped.
Why one duration span hides what streaming users feel
A single duration span hides what streaming users feel because a streamed answer has phases, and one number averages them together. Waiting for the first word, watching text arrive, and the stream ending are three different experiences with three different failure modes.
Take two responses that both last 20 seconds. One shows its first token at 600 ms and streams smoothly. The other shows nothing for 14 seconds, then dumps text in a burst. Same duration, opposite experience. A p95 on duration can't separate them.
There is a second problem. A span that ends when your handler returns can close before the stream finishes, or never close at all when the client drops. Aborted responses then show up as short, successful requests, or as missing data. Either way, the stalled, slow and vanishing responses your users complain about never become something you can query.
The fix isn't more spans. Record the moments that matter and an explicit end state.
The four timestamps and three end states worth recording
Record four timestamps and one of three end states, and you can answer almost every question about a slow or vanishing stream. Keep it that small. More fields mean more places to be wrong.
The four timestamps:
Request start: when your application accepted the request, before any provider call.
First meaningful output: when the first piece of content a user could actually see was produced.
Last output: when the final piece of visible content was produced.
Terminal state time: when you decided how the response ended.
The three end states:
completed: the stream ran to its natural finish.
cancelled: a client or your own code stopped the stream through an abort signal.
failed: an error ended the stream, from the provider, a tool, or your own code.
From these you derive the numbers that matter: time to first meaningful output (first minus start), streaming duration (last minus first), and the share of responses ending in each state. A rising cancelled rate with a flat failed rate is usually a latency problem users are voting on with their feet.
Which metrics matter for latency, cost and quality?
For latency, track time to first meaningful output, time between chunks and total duration. For cost, track input and output tokens per call and per run, and compute cost only where usage and model pricing are known. Track error and abort rates by end state. Quality is harder to measure from traces alone. What traces do give you are retries, failed tool calls and early user disconnects.
Transport chunk vs visible content: defining first meaningful output
First meaningful output is the first chunk that carries new, non-empty content a user could see, not the first chunk that arrives on the wire. Transport chunks and visible content are different things, and mixing them up makes your time-to-first-token number too optimistic.
A stream commonly opens with chunks that contain no text: a start event, role metadata, a usage placeholder, an empty delta. If you stamp "first output" on the first byte, you measure connection setup, not what the user felt. OpenTelemetry's GenAI conventions draw the same line for their time-to-first-chunk metric: a qualifying chunk contains new, non-empty output, and empty start events and metadata-only events don't count. That metric is named gen_ai.client.inference.time_to_first_chunk, a histogram in seconds.
Put the rule in your code, in one place:
function isVisibleContent(part: { type: string; text?: string }) {
  return part.type === 'text-delta' && !!part.text && part.text.length > 0;
}
The exact part names depend on your SDK version, so check the stream part types you actually receive. For an agent, decide deliberately whether a tool-call chunk counts as meaningful. If your UI renders a "searching..." indicator on tool calls, it might. If users only see text, it doesn't. Pick one definition, write it down, and keep it stable so trends stay comparable.
Modelling the lifecycle in OpenTelemetry: one span, events and attributes
Model the lifecycle as one span for the whole streamed response, with span events for the moments in between and attributes for the end state. This needs nothing beyond the standard OpenTelemetry API.
Start the span when you accept the request. Add an event named first_output the first time isVisibleContent returns true. Add last_output as you go, or keep its timestamp in a variable and write it once at the end. When the terminal state is known, set an attribute and end the span exactly once.
A workable attribute set:
stream.end_state:completed,cancelledorfailedstream.ttfo_ms: milliseconds from start to first meaningful outputstream.visible_chunks: count of chunks that passed your visibility rulestream.abort_source: where the abort came from, such asclient_signalorapp_timeoutstream.upstream_cancel_confirmed: boolean, covered below
Set span status to error only for failed. A cancelled stream isn't an error in most products, and painting it red buries real failures. Use span.recordException for failed streams so the error is attached.
Why one span and not a child span per phase? Because the phases aren't independent operations. They're moments inside one operation. Child spans make sense for provider calls and tool steps, and if your response runs inside a queue or worker, keep the parent link intact. For measuring run-level success and latency across whole agent runs, see AI Agent Monitoring: Measure Run Success and Latency.
What are best practices for agent observability?
Keep one span per agent run or model call, add events for lifecycle moments such as first chunk, and put the end state in attributes. Use child spans for tool calls and retrievals so the slow step is visible. Record token counts as the provider reports them, tag errors and aborts distinctly, and use OpenTelemetry conventions so any OTLP backend can read the data without lock-in.
How do I trace tool calls and token usage in an agent?
Wrap each tool call and retrieval in its own child span under the run span, recording name, duration and error status. Attach token usage to the model call span as attributes, using the counts the provider reports. If a stream is aborted, usage may be missing or partial, so mark it as unknown rather than guessing. That shows which step is slow and where tokens go.
Instrumenting a Vercel AI SDK streamText route (abortSignal, onAbort, onError, onFinish)
In a Vercel AI SDK route, pass the request's signal as abortSignal, then use onAbort, onError and onFinish to set exactly one end state. The AI SDK documents abortSignal as the way to cancel a stream and describes handling errors and aborts in its error handling guide. Callback signatures differ across SDK versions, so confirm them against the version in your project before copying anything.
import { trace, SpanStatusCode } from '@opentelemetry/api';
import { streamText } from 'ai';

const tracer = trace.getTracer('chat-route');

export async function POST(req: Request) {
  const { prompt } = await req.json();
  const span = tracer.startSpan('chat.stream');
  let ended = false;
  let firstSeen = false;
  const t0 = Date.now();

  const end = (state: 'completed' | 'cancelled' | 'failed', err?: unknown) => {
    if (ended) return; // one terminal state, once
    ended = true;
    span.setAttribute('stream.end_state', state);
    if (err) {
      span.recordException(err as Error);
      span.setStatus({ code: SpanStatusCode.ERROR });
    }
    span.end();
  };

  const result = streamText({
    model,
    prompt,
    abortSignal: req.signal,
    onAbort: () => {
      span.setAttribute('stream.abort_source', 'client_signal');
      end('cancelled');
    },
    onError: ({ error }) => end('failed', error),
    onFinish: () => end('completed'),
  });

  // Tap the stream for visible content
  (async () => {
    for await (const part of result.fullStream) {
      if (part.type === 'text-delta' && !firstSeen) {
        firstSeen = true;
        span.addEvent('first_output');
        span.setAttribute('stream.ttfo_ms', Date.now() - t0);
      }
    }
  })().catch(() => {});

  return result.toTextStreamResponse();
}
Three details matter. First, the ended guard: callbacks can race, and a span ended twice is a bug. Second, don't assume onFinish runs on an abort. Treat onAbort as its own path. The fullStream iterable also emits an abort part and typed error parts, so you can handle either there instead of in callbacks. Third, if you persist partial output, onAbort is where the docs point for cleanup work, which makes it the natural place to record how much visible content was produced before the stop.
Browser disconnect is not confirmed upstream cancellation
A browser disconnect tells you the client left. It doesn't tell you the provider stopped generating. Record these as two separate facts.
When the user closes the tab, your server may see the request signal abort. Whether that propagates all the way to the model provider depends on your runtime, your hosting, and whether you passed the signal into the provider call. The AI SDK docs note that on Vercel, request cancellation is only supported in the Node.js runtime and must be enabled for each function that needs it. If it isn't enabled, your handler may keep running after the user is gone.
So model it honestly. Set stream.end_state to cancelled when your code observed an abort. Set stream.upstream_cancel_confirmed to true only when you have evidence the upstream call actually ended, for example the provider call rejected with an abort error in your own code. Otherwise leave it false or unset. A query for cancelled with upstream_cancel_confirmed = false gives you a direct list of streams where you may be paying for output nobody sees.
This distinction is the whole point of owning the lifecycle in your application. Infrastructure logs will show a closed connection. Only your code knows whether it told the provider to stop.
What you can and can't claim about tokens and cost on an abort
On an abort, claim only what the provider reported, and treat missing usage as missing, not zero. Providers differ in whether they send usage data for a stream that was cut short, and many send it only at the end of a completed stream. An aborted stream may never get there.
Three rules keep your numbers honest:
If usage arrived, record it and say so. If it didn't, leave the token attributes unset instead of writing 0.
Don't estimate tokens from visible characters and present the result as billed usage. If you want an estimate, name the attribute clearly, such as
stream.estimated_output_tokens.Never assume an aborted stream cost nothing. Output generated before the stop, and possibly after your disconnect if upstream wasn't cancelled, may still be billed.
The same applies when a stream ends in failed. Partial output may exist, usage may not. For a closer look at incomplete streams and usage reporting on one provider, see Bedrock Streaming Token Usage: Handle Incomplete Streams. Cost computed from tokens is only as good as the token counts you actually received.
Verifying it: sending the spans to any OTLP backend, including telemetry.dev
Verify the instrumentation by exporting the spans over OTLP/HTTP and checking that every request produces exactly one span with one end state. Any OTLP backend works, because the spans use plain OpenTelemetry.
telemetry.dev is LLM observability for AI apps and agents, built on OpenTelemetry, and it accepts spans from any OTLP/HTTP exporter or OpenTelemetry Collector. It also has a first-party Vercel AI SDK integration, so the model-call spans and your lifecycle span can land in the same trace. The free plan is $0 with 30k units and 14-day retention. Pro is $25 per month for 500k units, and Team is $50 per month for 2M units.
A short verification checklist:
Make a normal request. Expect
end_state = completed, afirst_outputevent, and a plausiblettfo_ms.Close the tab mid-stream. Expect
cancelledandabort_sourceset.Force a provider error. Expect
failedwith the exception attached.Count spans against requests. Any gap means a path that never ends the span.
If spans go missing, check sampling before you blame your code.
Which frameworks and platforms support agent monitoring?
Any backend that accepts OTLP/HTTP can receive agent spans, so you're not tied to one framework. telemetry.dev offers TypeScript and Python SDKs and integrations for OpenAI, Anthropic, Google Gemini, AWS Bedrock, OpenRouter, LiteLLM and the Vercel AI SDK, plus setup guides for LangChain/LangGraph, Pydantic AI, CrewAI and Claude Code. Integration doesn't mean every framework event is captured, so check your traces.
How do I compare agent monitoring tools?
Compare on what you actually need: OTLP ingestion, tracing of tool steps and streams, cost and token tracking, retention, data location, self-hosting and pricing model (per seat versus per workspace). Test each with your own streamed route before committing. Because the spans in this post are plain OpenTelemetry, you can send them to more than one backend and judge for yourself.
What is AI agent monitoring?
AI agent monitoring is recording what an agent does at runtime so you can explain a slow, failed or stalled run. That means tracing each model call, tool step and retrieval, and tracking latency, token usage, cost and errors per step. For streamed responses it also means capturing the stream lifecycle: first visible output, completion, abort or error. One request-duration span can't show which step caused the delay.
Instrument one streaming route this week and query the cancelled ones first
Streamed responses fail in ways a duration span can't show, and the cheapest fix is the one you own: one span, four timestamps, three end states, and an honest flag for whether upstream cancellation was ever confirmed. Start with your highest-traffic streaming route, add the ended guard, and send the spans to telemetry.dev's free plan over OTLP/HTTP. Then filter for cancelled streams with unconfirmed upstream cancellation. That list is where your stalled, vanishing and quietly expensive responses are hiding.
Share this article