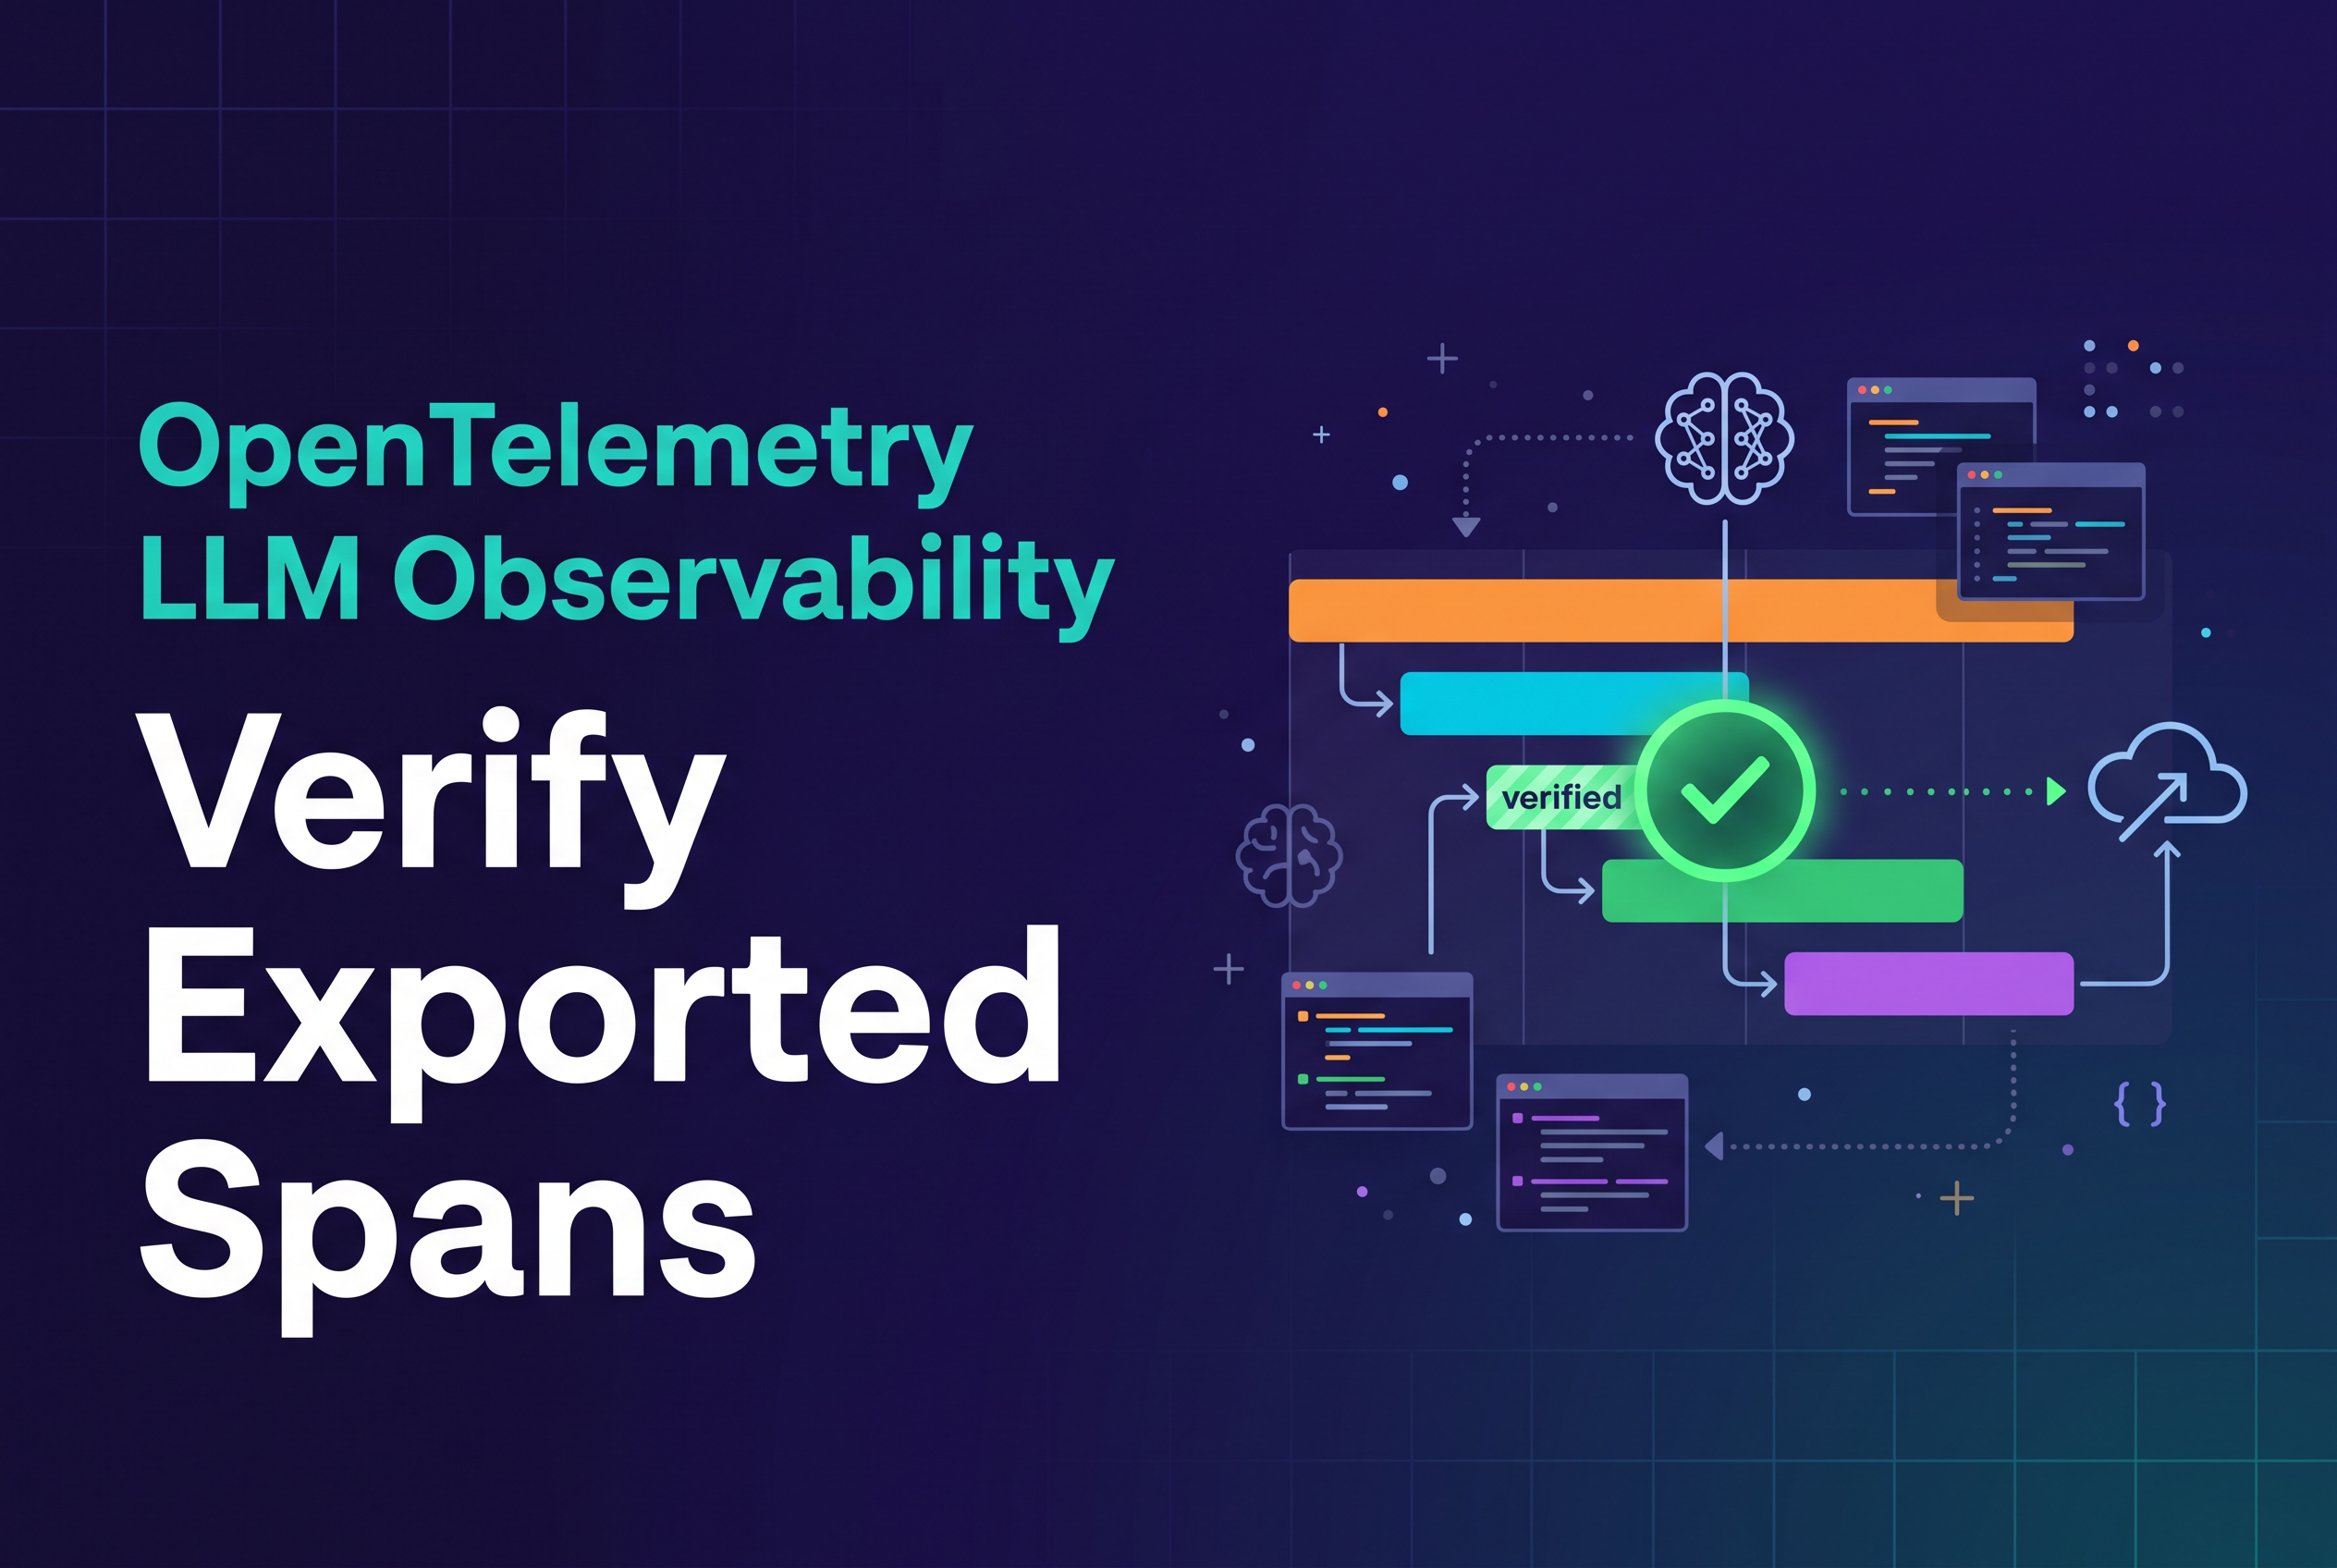
OpenTelemetry LLM observability works when one known model call and one tool step leave your app with complete attributes, pass through a Collector you can read, and show up as a single trace in a backend you can open. Anything short of that is a guess. This post is an acceptance checklist you can run in an afternoon, in TypeScript or Python, before you trust a dashboard.
Keep two facts apart: a span reached your Collector, and a span reached your backend. Those are different claims. A debug exporter proves the first. Only inspecting the trace in the backend proves the second.
telemetry.dev is LLM observability for AI apps and agents, built on OpenTelemetry, so it is one backend you can point this checklist at. The steps work for any OTLP/HTTP destination.
What 'working' means for OpenTelemetry LLM observability
A working setup means five things are true at once: the spans are complete, they share one trace ID, parent and child relationships are correct, the model and token attributes are present, and the backend shows the same trace you sent. A dashboard with a few charts can look healthy while spans are missing parents or carry no token counts.
The GenAI semantic conventions are the shared vocabulary for model-call attributes, such as the operation name, the model, and input and output token counts. Tools that read OpenTelemetry data, including OpenLLMetry, OpenLIT and the OpenInference ecosystem behind Arize Phoenix, rely on those names or close relatives of them. Datadog and Grafana Cloud also accept OTLP, though emitted attribute names alone do not determine what appears in a backend, as vendor-specific mapping and configuration affect how attributes are represented (for example, Datadog maps some OpenTelemetry resource attributes to equivalent Datadog conventions). Check the spec version you are targeting, because the GenAI conventions keep changing.
Treat the next five steps as a pass or fail test. If a step fails, stop there. Don't move on and hope the backend sorts it out.
What are the best practices for LLM observability?
Trace every model call, tool step and retrieval as its own span with a parent link, so a failed or slow run can be traced to one step. Record model name, token counts, latency and error status on each span. Verify with a synthetic call before trusting dashboards. Check sampling and flushing, because dropped spans look like missing data. Treat prompt and response capture as opt-in, since redaction can't be assumed to catch all sensitive data.
Step 1: Create one synthetic model call and one tool step
Send exactly two units of work: one model call and one tool step that is a child of it. Use a fake prompt and a canned response so nothing sensitive is ever exported. You are testing the pipeline, not the model.
Pick values you can recognize later. A model name like test-model, a prompt of hello, fixed token counts such as 12 input and 34 output, and a tool name like lookup_synthetic. Distinctive numbers make the debug output easy to scan.
Wrap both in one parent span so you get a clear tree: a root span for the run, a child for the model call, and a child for the tool step. Set the GenAI operation name on the model span, for example chat, and on the tool span, for example execute_tool. If your instrumentation library creates these spans for you, run it against a stub provider. If you are instrumenting by hand, set the attributes explicitly. The existing OpenTelemetry setup reference covers wiring a span processor or exporter, so this step only needs the spans to exist.
End every span and let the process finish its work before you exit. A span that is never ended is never exported.
Is there an OpenTelemetry example for Python and Node?
Yes. The pattern is the same in both: start a parent span for the request, then create a child span for the model call and another for the tool step. In Python use the opentelemetry-sdk tracer, and in Node or TypeScript use @opentelemetry/api with the Node SDK. Set attributes such as model name and token counts on the model span, then end the spans and flush. telemetry.dev also ships first-party TypeScript and Python SDKs if you prefer a wrapper.
Step 2: Read the Collector debug exporter output (trace IDs, parent IDs, model and token attributes)
Run a local Collector with the debug exporter in the traces pipeline and read what it prints before you route anywhere else. The Collector's own troubleshooting guidance recommends sending test data to a Collector configured to output to local logs, using a local or debug exporter to inspect processed data for configuration and network debugging. That is exactly this use.
Point your app's OTLP/HTTP exporter at the Collector, run the synthetic call once, and check the printed spans against this list:
One trace ID. All three spans (run, model, tool) share the same trace ID. Two trace IDs means context was lost between steps.
Correct parent IDs. The model and tool spans name the run span as parent. A tool span with no parent is an orphan and will float as its own root in a backend.
Model attributes. The model name and operation name are present and match what you set.
Token attributes. The input and output token counts equal your fixed 12 and 34. Zero, missing or swapped values point at instrumentation, not the pipeline.
Span names and status. Names are meaningful, and no span is marked as an error unless you forced one.
If the Collector prints nothing, you have a receipt problem, not an attribute problem. Check the endpoint, the port and the protocol before touching instrumentation. Debug output can contain whatever you attached to spans, which is why this step uses synthetic payloads. For deciding what content belongs on a span at all, see OpenTelemetry GenAI Prompt Capture: Inspect Before Export.
Which LLM performance metrics does OpenTelemetry capture?
OpenTelemetry can capture latency as span duration, input and output token counts as span attributes, error status and exception events, and request counts or token totals as metrics. Cost is not a native field. It is usually derived from token usage multiplied by model pricing, so it is only as accurate as the reported tokens and the pricing match. Use the debug exporter to confirm these attributes appear before you rely on them.
Step 3: Rule out sampling and unflushed spans before blaming the pipeline
Missing spans are usually your SDK's doing, not the Collector's, so rule out sampling and flushing first. Two causes account for most empty debug output in short test scripts.
Sampling. The SDK decides at span creation whether a span is recorded and sampled, and a sampler that drops it means nothing is exported. The specification lists built-in samplers including AlwaysOn, AlwaysOff and TraceIdRatioBased. During acceptance, force AlwaysOn so a ratio sampler can't hide your single test trace. Restore your production sampler afterward and rerun once to confirm the trace still arrives at the rate you expect.
Unflushed spans. Batch span processors hold spans in memory and export on a timer or batch size. A script that ends in under a second can exit before the batch goes out. The same specification describes ForceFlush, which exports spans not yet exported, and Shutdown, which does cleanup. Call both before the process exits. In serverless or short-lived jobs, this is the most common reason a trace never appears.
If you switch to a simple span processor for the test, each span exports as it ends, which takes batching out of the equation. Put the production processor back when you are done.
Step 4: Switch to OTLP/HTTP and tell local receipt from backend ingestion
Local receipt means your Collector saw a span. Backend ingestion means the backend stored it and can show it. Don't report success on the first one. Between them sit auth, endpoint paths, payload limits, project routing and retries, and any of them can drop data after the Collector has already printed it.
Now route the same synthetic run to your backend over OTLP/HTTP. You can export straight from the SDK, or keep the Collector in the middle and add an OTLP/HTTP exporter alongside the debug exporter. Keeping both lets you compare what left the Collector with what the backend shows. If your Collector needs credentials, see OpenTelemetry Collector Environment Variables for Auth rather than hardcoding secrets in config.
Watch for these signs of a gap between receipt and ingestion:
The exporter logs an HTTP error such as 401, 403 or 404, or a retry message.
The Collector's debug output shows the spans, but the backend shows nothing after a reasonable wait.
The backend shows the trace but without token or model fields, meaning attributes were dropped or renamed on the way.
A clean HTTP success from the exporter is encouraging, but it is still not the backend's view. Confirm in the backend itself. For telemetry.dev, the setup page above covers pointing a standard OTLP/HTTP exporter or its span processor at the service.
How do I monitor large language models with OpenTelemetry?
Instrument your model calls, tools and retrievals so they emit spans, then export them over OTLP/HTTP to a backend that stores and displays traces. Confirm the Collector received the spans, then confirm the backend ingested them, since these are separate checks. Any OTLP/HTTP exporter works with telemetry.dev, so you can keep your existing instrumentation. Then watch latency, token usage and errors per trace to find slow or failing steps.
Step 5: Inspect the trace in the backend, then remove the debug exporter
Open the trace in the backend and compare it, field by field, with what the debug exporter printed. This is the only step that proves ingestion.
Check that you see one trace with three spans in the right tree, that the model name and the 12 and 34 token counts match, and that the tool span sits under the run. If your backend computes cost or latency from these fields, check that those derived numbers look sensible for your synthetic values. Cost in particular depends on reported token usage and a model pricing match, so a fake model name may show no cost. That is expected and not a pipeline fault. For how spend ties back to runs, see AI Cost Observability: Trace Spend to Agent Runs.
Then clean up. Remove the debug exporter from the traces pipeline, restore your production sampler and span processor, and delete any test config that logs full span contents. A detailed exporter left running in production writes every span, and anything attached to it, into Collector logs. Rerun the synthetic call once after cleanup to confirm the trace still arrives with only the production path active.
The acceptance checklist and when to rerun it
Run this list top to bottom and stop at the first failure.
One synthetic model call and one child tool step are created with fixed, recognizable values.
The Collector debug exporter prints all spans under one trace ID.
Parent IDs form the expected tree, with no orphan spans.
Model name, operation name and token counts match what you set.
Sampler is AlwaysOn for the test, and
ForceFlushandShutdownrun before exit.The same run exported over OTLP/HTTP, with no auth or HTTP errors.
The backend shows the full trace with matching fields, recorded separately from the Collector receipt.
Debug exporter removed, production sampler and processor restored, and one final rerun passes.
Rerun it whenever the ground shifts: after upgrading an OpenTelemetry SDK or instrumentation library, after changing providers or models, after adding a framework such as the Vercel AI SDK or LangChain, after changing sampling, and after moving the Collector or rotating credentials. Frameworks that retry or fan out tool calls deserve a second pass. Agent Telemetry: Trace Retries and Tool Failures covers what those spans should look like. For tracing a specific framework end to end, see How to Trace Vercel AI SDK Calls with OpenTelemetry.
Run the checklist once, then trust the dashboard
A dashboard is only as honest as the spans behind it, and one synthetic run tells you whether those spans are complete, correctly parented and actually stored. Do the eight checks, keep Collector receipt and backend ingestion as separate line items, and rerun after every upgrade. To try it against a real backend, point your OTLP/HTTP exporter at telemetry.dev on the free plan (30k units, 14-day retention) and follow the OpenTelemetry setup guide at telemetry.dev/docs/sdk/opentelemetry.
Share this article