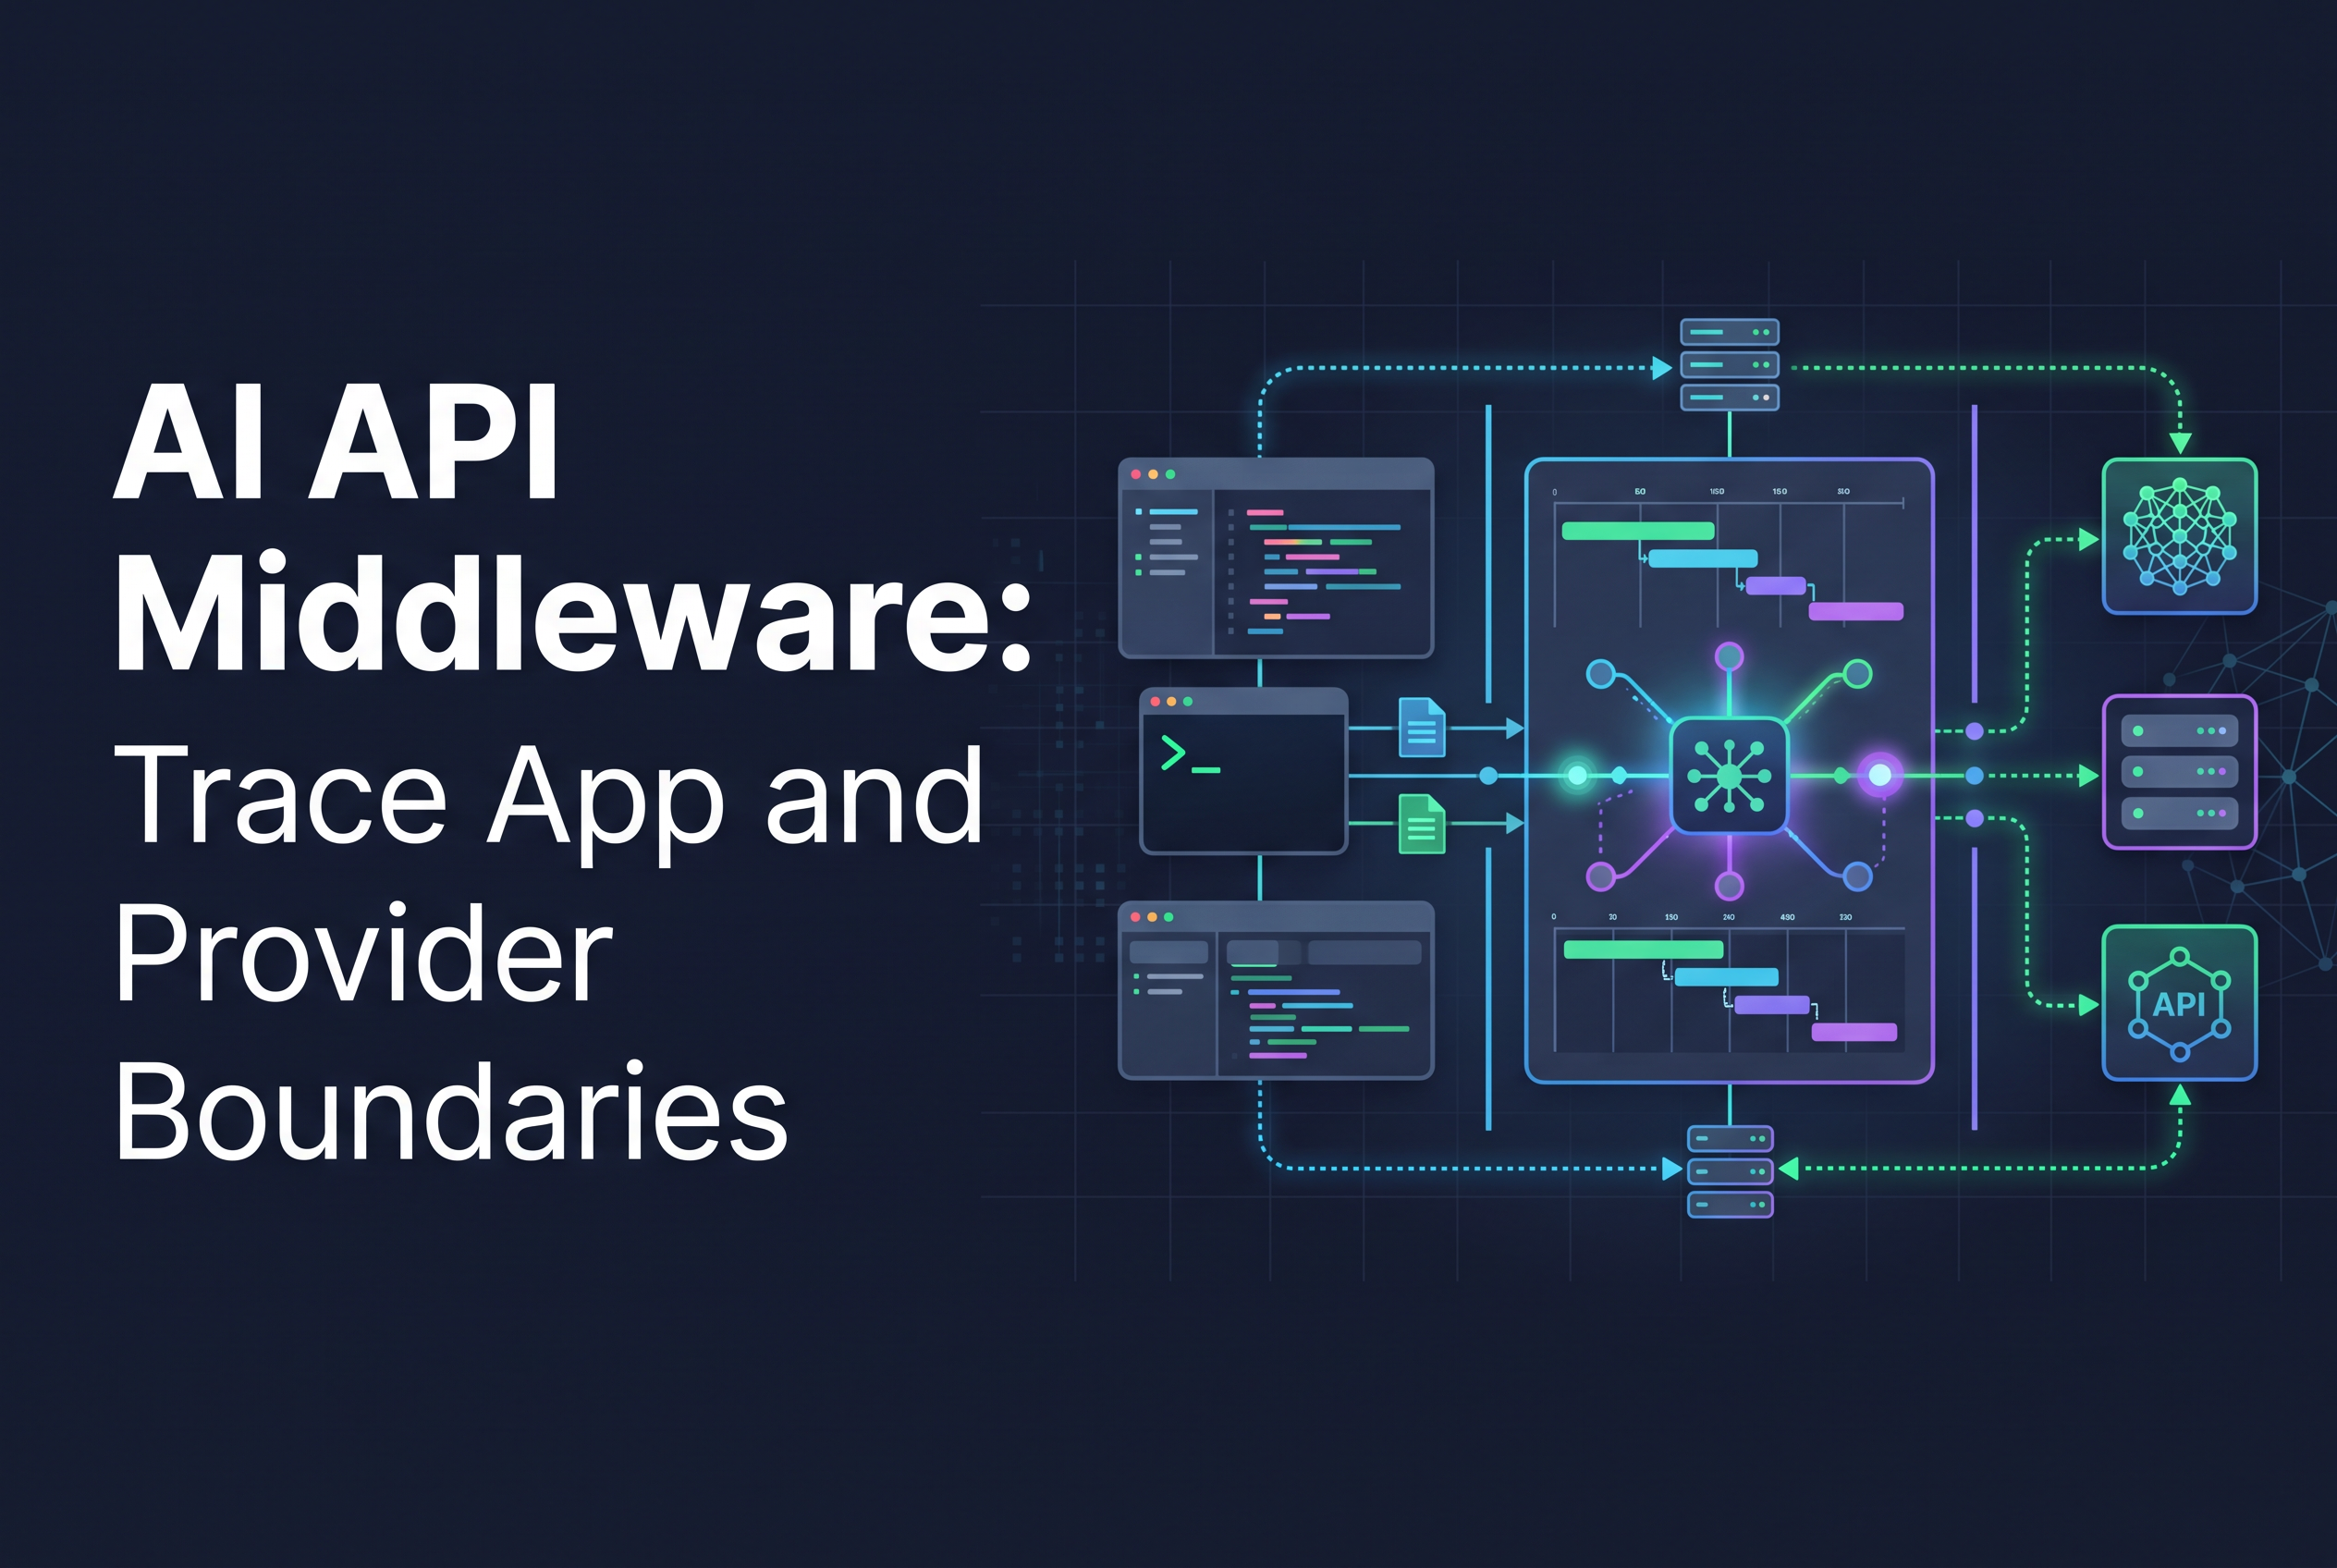
AI API middleware is code that wraps your model calls so you can change, log or guard requests and responses in one place. It is not the same thing as an AI gateway, which is a network hop that controls traffic, and it is not an observability backend, which only records what happened.
Most confusion comes from vendors using "AI middleware" for all three. This post separates them for small TypeScript and Python teams, then shows which boundaries to trace with OpenTelemetry so that middleware, SDK and gateway don't each emit a conflicting version of the same call.
What AI API middleware means (and the three layers people confuse)
AI API middleware is a function or wrapper that sits between your application logic and a model provider's API and can inspect or modify what passes through. You use it for control at a seam you own: adding a system prompt, redacting input, caching a response, retrying, logging.
Three different things get that label:
Application middleware. Code in your process that wraps model calls. The Vercel AI SDK ships this as language model middleware, which can intercept and modify calls to a model. Grafana's AI SDK documents the same pattern for its own middleware layer.
AI gateway. A separate service your traffic passes through on the way to OpenAI, Anthropic, Gemini, Bedrock or OpenRouter. It owns routing, keys, quotas and fallbacks.
Observability backend. A system that receives telemetry. It never sits in the request path.
General explainers such as Kosmoy's overview of AI middleware lump these together as one category. For a 5-person team, that framing hides the real decision: which of these three do you actually need to run?
What should AI API middleware do in 2026?
Good AI API middleware in 2026 does three narrow jobs: wrap each provider call with retries and timeouts, attach request context such as user, feature and model, and emit OpenTelemetry spans so the call can be inspected later. Keep it thin. Provider SDKs and frameworks like the Vercel AI SDK, LangChain and LiteLLM change quickly, so logic tied to one provider ages badly. Emitting standard OTLP spans keeps your options open, because any compatible backend can read them without a rewrite.
Application middleware vs AI gateway vs observability backend: who controls what
Application middleware controls what your code sends, a gateway controls what leaves your network, and an observability backend controls nothing. That last part is a feature. A backend that can't block a request can't take your product down either.
| Layer | Lives in | Can change the request? | Typical jobs |
|---|---|---|---|
| Application middleware | Your process | Yes | Prompt edits, input redaction, retries, tool-call wrapping, in-process caching |
| AI gateway / LLM gateway | A network hop | Yes | Provider routing, shared keys, rate limits, fallbacks, org-wide budgets |
| Observability backend | Off the request path | No | Store and query traces, logs, metrics; show cost, latency, tokens, errors |
If you only call one provider from one service, application middleware is usually enough. Reach for a gateway when several services share keys or you need one place to enforce quotas. Add a backend either way, because neither layer tells you afterwards why a run was slow or expensive unless something records it.
The common objection is "my gateway already has a dashboard." It sees the hop, not your app. It can't tell you which tool step ate eight seconds before the provider call.
What counts as an AI API management tool?
An AI API management tool is usually one of three things: a gateway that routes, caches and rate-limits provider calls, middleware in your own code that wraps calls, or an observability backend that records what happened. They answer different questions. A gateway controls traffic, middleware controls behaviour inside your app, and a backend like telemetry.dev only observes the traces, tokens, cost, latency and errors those layers emit. Most small teams need observability first and add a gateway only when routing or key management becomes a real problem.
Which boundaries to trace: request, provider call, tool step
Trace three boundaries and give each its own span: the request, the provider call, and the tool step.
Request. One span per user-facing action or agent run. This is the parent. It carries your own attributes such as user, route or job ID, so you can ask "which runs were slow" rather than "which calls."
Provider call. One span per model call, child of the request. Model name, latency, token counts and errors belong here. Wrap it in your middleware so every call path produces it, with retries as separate child spans.
Tool step. One span per tool or retrieval the model asks for. Agents fail here more often than at the provider. The model returns a function call, your code runs it, and a timeout or bad argument looks like a model problem unless the tool has its own span. Our guide on tracing retries and tool failures walks through the retry case.
If you use the Vercel AI SDK, tracing its calls with OpenTelemetry already gives you most of the provider-call layer. Your middleware then adds the request and tool spans around it.
Where does chat and function calling middleware belong in an agent?
Chat middleware belongs around each model call, and function calling middleware belongs around each tool step. Both should create their own span, nested under the request that triggered them. A slow or failed run then shows which model call was slow, which tool was invoked, what arguments it received and where the error happened. Frameworks such as LangChain/LangGraph, Pydantic AI and CrewAI offer hooks for this, but check what each hook actually captures, since integration support doesn't guarantee every event or attribute is recorded.
Propagating context and avoiding duplicate spans when middleware, SDK and gateway all instrument
Duplicate spans happen when two layers each create a span for the same provider call. Decide which layer owns that span and let the others add attributes or stay quiet.
Start with context. OpenTelemetry propagates trace context between services by passing it along with the request, so a child span knows its parent. In-process, that means running your middleware inside the active context. Across a gateway hop, the trace context headers must reach the gateway and come back out the other side.
Then apply three rules:
One owner per boundary. If your middleware wraps the provider call, turn off auto-instrumentation for the same client, or the SDK and the middleware will both record it.
Gateway spans are children, not replacements. A gateway that honors incoming trace context should show up under your provider-call span, so you see app time and gateway time separately. We cover this exact setup in LiteLLM tracing: correlating app and gateway requests.
Check the trace, not the config. Send one request and count spans. Two spans with the same model and near-identical duration mean double instrumentation.
Any OTLP/HTTP exporter or OpenTelemetry Collector can carry these spans to your backend, so you can fix duplication in the pipeline if you can't fix it at the source.
Streaming errors and missing token usage: what the middleware can and can't know
Middleware only knows what the stream tells it. For streaming calls that's the weak spot, so design for incomplete data.
If the connection drops or the provider errors mid-stream, your wrapper sees a stream that simply ends. Mark the span as errored when the stream closes without a terminal event. A started stream is not a successful one.
Token usage is the second gap. Many providers report usage only in the final chunk, and some only when you opt in. If the stream is cut off, that chunk never arrives. You can leave token counts empty or estimate them yourself. Prefer empty. A guessed number in a cost chart is worse than a visible hole. The Bedrock case is a good example, covered in handling incomplete streams for token usage.
The same logic applies to cost. Computing it needs reported token usage and a matching price for the model, so missing usage means missing cost. For more on tying spend back to runs, see AI cost observability.
Middleware also can't see what happened inside a provider or gateway after it hands the request off. Only trace context passing through to a downstream span fills that in.
Where telemetry.dev fits: an OpenTelemetry backend for the traces your middleware emits
telemetry.dev is LLM observability for AI apps and agents, built on OpenTelemetry. It is the backend in the table above. It receives traces from your middleware, SDK or gateway and shows model calls, tool steps and retrievals with cost, latency, token and error tracking.
It is not a gateway, cache, rate limiter or guardrail, and it does not sit in your request path. It won't block, route or rewrite a call. Keep your middleware or gateway for that, and send telemetry here.
Setup guides cover LangChain/LangGraph, Pydantic AI and CrewAI. Any OTLP/HTTP exporter or OpenTelemetry Collector works, so you aren't locked to one SDK.
On privacy, prompt capture can be turned off per environment before storage, and redaction patterns apply but can't catch all sensitive data. If your middleware already redacts input, keep that as the first line.
Pricing is per workspace: Free is $0 with 30k units and 14-day retention, Pro is $25/month for 500k units, and Team is $50/month for 2M units with unlimited projects and seats.
Is telemetry.dev an AI API middleware solution?
No. telemetry.dev is an observability backend, not middleware or a gateway. It doesn't sit in your request path or route traffic. It receives the traces your middleware, SDKs or gateway emit and shows tokens, cost, latency and errors. It has first-party TypeScript and Python SDKs, and any OTLP/HTTP exporter works. The free plan covers 30,000 units with 14-day retention.
A small-team checklist: what to build, buy or skip
Build thin application middleware, skip a gateway until you feel the pain, and buy a backend early. That order matches where small teams actually lose time.
Build: a wrapper around your model calls that creates the request, provider-call and tool-step spans. Keep it small. If you use the Vercel AI SDK, start from its middleware hooks rather than writing your own.
Build: one rule for who owns each span, written down, so SDK and middleware never both instrument the same call.
Buy or adopt: an OpenTelemetry backend so traces are queryable. Without one, middleware emits data nobody reads.
Defer: an AI gateway, until several services share provider keys or you need central quotas and fallbacks. When you add one, pass trace context through it.
Skip: estimating token counts for cut-off streams. Leave the field empty and mark the span.
Check: send one request, open the trace, and confirm there is one span per boundary, not two.
What are the best practices for integrating AI APIs?
Wrap every provider call in one place so timeouts, retries and error handling are consistent. Record model, token counts, latency and errors on each call from day one, because unexplained spend and slow runs are the usual first production problems. Pass trace context through every layer to avoid duplicate or orphaned spans. Treat prompts and outputs as sensitive data and decide deliberately what to capture. Skip a gateway and custom tooling until a concrete need appears, and keep telemetry in standard OpenTelemetry formats.
Conclusion
Application middleware changes your calls, a gateway governs your traffic, and a backend explains what happened. Small teams should build the first thin, delay the second, and wire up the third before the first production incident. Create a free telemetry.dev workspace (30k units), point your middleware's OTLP exporter at it, and run one request through the request, provider and tool boundaries to confirm each shows up once.
Share this article