To avoid double counting in LLM cost monitoring, pick one layer (your app or your gateway) as the source of truth for usage, then count billable provider attempts instead of summing every span that carries a token attribute. When both a LiteLLM or OpenRouter gateway and your app instrumentation report usage for the same upstream request, a naive sum counts that request twice.
The symptom is easy to spot. Your trace backend says 2.4M input tokens for the week, the provider invoice says 1.3M, and nobody changed a prompt. Neither number is wrong. They measure different things, and you added them together.
This guide is narrow on purpose. It covers the accounting rules and an offline aggregation you can run against exported span data. It skips tracing setup and the full cost workflow, which live in the LiteLLM tracing guide and the AI cost observability guide.
Why LLM cost monitoring double counts when a gateway is in the path
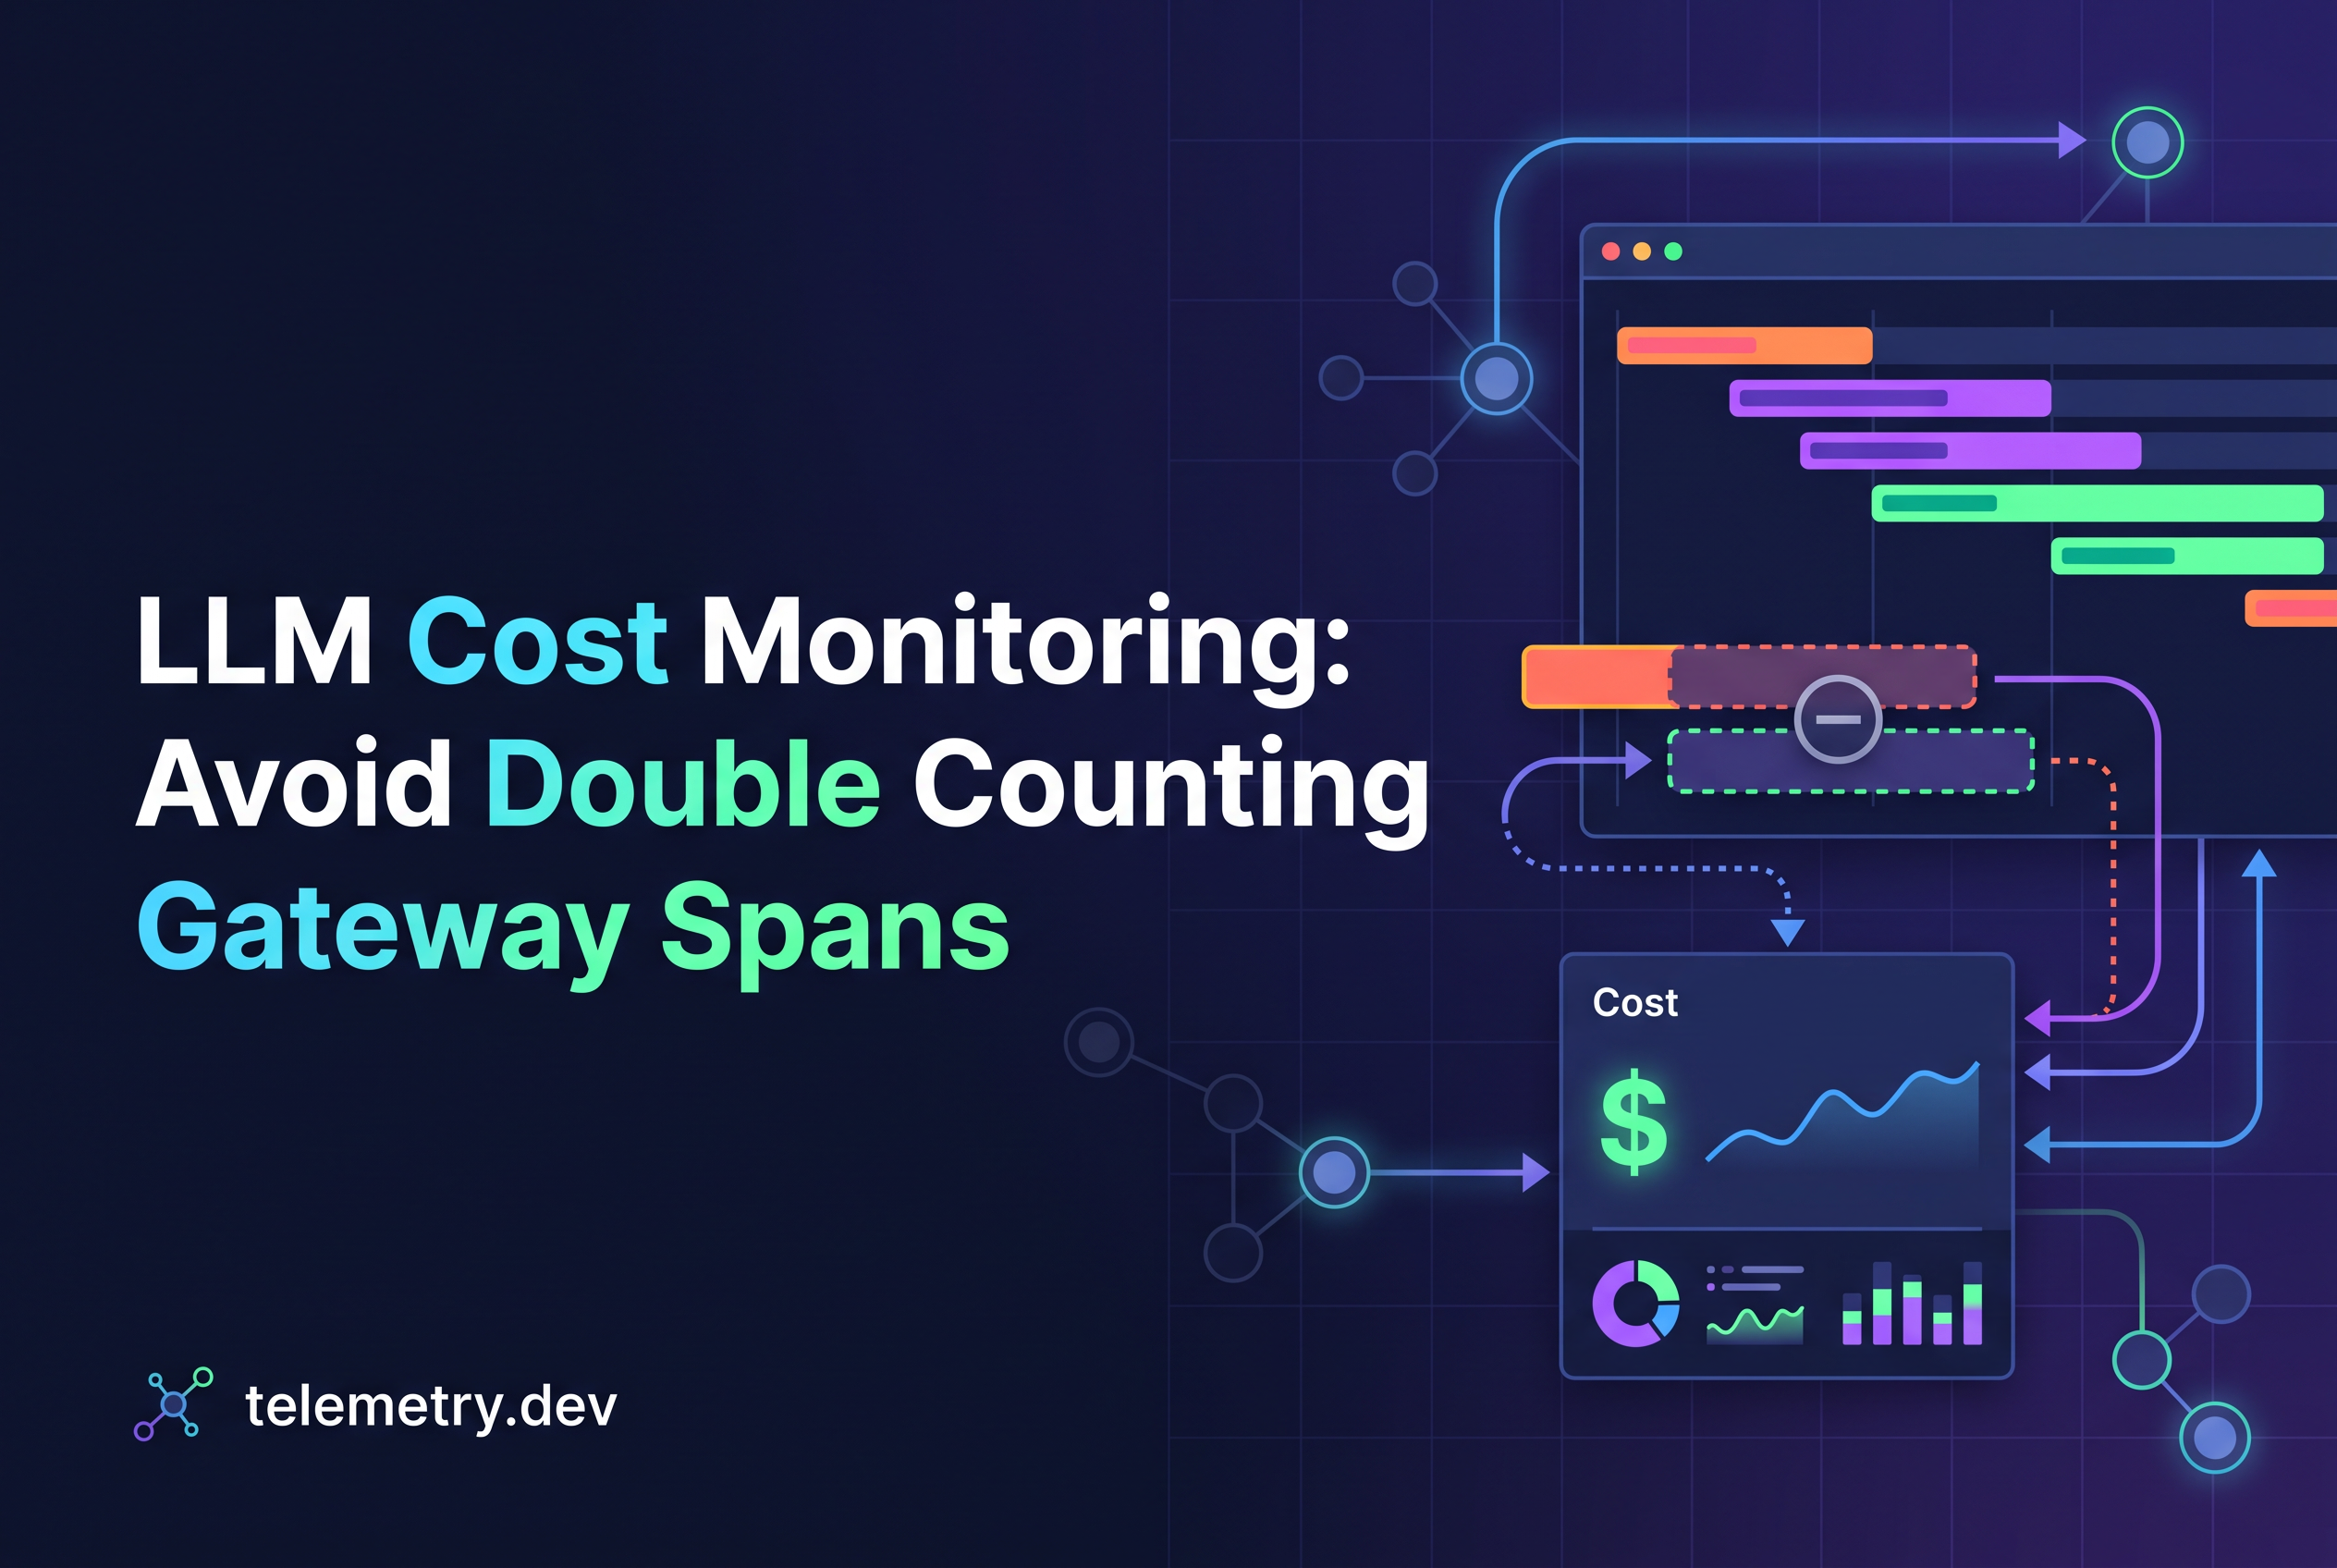
Double counting happens because two layers each report usage for the same provider call, and a naive aggregation treats every span as an independent event. Your app wraps the model call in an instrumented client span with token attributes. The gateway receives that call, forwards it upstream, and emits its own span with token attributes too. One request, two spans, two usage numbers.
The OpenTelemetry GenAI conventions put input and output token counts on the client inference span as recommended attributes. Nothing in them tells a backend which of two overlapping spans to trust. If you emit usage at both the app-to-gateway hop and the gateway-to-provider hop, summing across all spans double counts. A smarter query won't fix it. You have to decide which layer owns the number.
A gateway adds its own wrinkles. Retries and fallbacks happen inside it, so the app sees one call while the provider sees several. Errors run in both directions: you can overcount (two layers) and undercount (the app never saw the retry). Treat the invoice as the arbiter and the spans as evidence you have to account for carefully.
Logical requests vs billable provider attempts (and why a shared trace ID proves nothing)
A logical request is what your code asked for. A billable provider attempt is one HTTP call the provider actually processed and charged. Cost lives at the attempt level. One logical request can produce one attempt, or three if the gateway retried twice and then fell back to another model.
A shared trace ID doesn't tell you which case you're in. Two spans in one trace might be the same attempt reported twice (a duplicate), or two different attempts under one logical request (a retry). Same trace ID, opposite accounting answers. A request ID has the same problem, since gateways often reuse one ID across retries.
So stop asking whether two spans share an ID. Ask whether they describe the same provider response. Evidence that they do: matching provider response ID, matching token counts, and a client span that fully contains a server-side span in time. Evidence they don't: different response IDs, different models, or sequential non-overlapping timestamps. Correlation gets you to the right neighborhood. Only attempt-level evidence settles the count.
A worked synthetic trace: two reporting layers, one upstream request
Here is a synthetic trace, invented for illustration, for one chat completion that goes through a gateway and needed one retry. The app span is the logical request. The gateway reports each provider attempt.
| Span | Layer | Parent | Model | Input tokens | Output tokens | Notes |
|---|---|---|---|---|---|---|
chat.handle |
app | none | n/a | none | none | Aggregating parent, sums children |
llm.call |
app | chat.handle |
gpt-4o | 1,200 | 300 | App-side usage, logical request |
gateway.request |
gateway | llm.call |
gpt-4o | 1,200 | 300 | Gateway total for the logical request |
gateway.attempt #1 |
gateway | gateway.request |
gpt-4o | none | none | Provider returned 503, no usage reported |
gateway.attempt #2 |
gateway | gateway.request |
gpt-4o | 1,200 | 300 | Succeeded, billed |
Sum llm.call and gateway.request and you get 2,400 input and 600 output tokens. Add attempt #2 and it climbs to 3,600 and 900. The provider billed 1,200 and 300, once.
Notice attempt #1 too. It reported nothing. That is not a zero-cost call. It is an unknown. Some providers don't bill a 503, others bill partial work. The span can't tell you, so don't write a zero into your totals.
Choose one accounting layer and apply four counting rules
Choose the layer closest to the provider that reports provider-supplied usage per attempt. In the trace above that is gateway.attempt. If your gateway only reports one aggregate span per logical request and hides attempts, choose the app layer and accept that retries are invisible to you. Never mix layers in one sum.
Once the layer is chosen, apply four rules:
Count attempts, not spans. One billable provider attempt is one unit of usage, however many spans describe it.
Count retries and fallbacks as distinct attempts. Each one is a separate provider call with its own charge.
Exclude aggregating parent spans. A span that already sums its children's usage is a rollup, not a call.
Treat missing usage as unknown, not zero. Report it separately so the total reads "at least X, plus N unknown attempts."
These rules are deliberately boring. They are the ones your accountant would apply to any system with two ledgers: pick one, and reconcile the other against it.
How do I instrument LLM workloads for cost attribution?
Record model name, input tokens, output tokens and a stable attribution key such as feature, user or agent run on the span that represents one billable provider attempt. Pick a single layer to carry that data, either your app SDK or the gateway, so nothing is counted twice. Add the attribution key as a span attribute at call time, then group by it when summing. If a provider omits usage, leave tokens empty rather than guessing.
Count retries and fallbacks as distinct attempts, exclude aggregating parent spans, treat missing usage as unknown
Retries and fallbacks are separate attempts because the provider charges per call it processes, however your gateway frames the sequence. If attempt #1 fails mid-stream and attempt #2 succeeds, you may owe for both. Collapsing them into one logical request hides the exact spend you're hunting for. A gateway that retries aggressively is a cost leak, and it only shows up when you count attempts individually.
Aggregating parents are the other trap. In the synthetic trace, gateway.request reports 1,200 and 300 because it summarizes its child attempts. It is a rollup. If you chose the attempt layer, drop it from call totals. If you chose the request layer, keep it and drop the attempts. Either is fine. Both is the bug.
Missing usage deserves its own bucket. A span with no token attributes is not free. The AI cost observability guide makes the same point from the instrumentation side: a call that reports nothing contributes $0.00 to a naive sum while the real call still lands on your invoice. Count the unknowns, show the count next to the total, and chase them down one model or code path at a time.
How do I monitor cost for agentic AI runs?
Agents multiply cost because one task triggers many model calls, tool steps, retries and fallbacks. Trace the whole run, but sum tokens only on the spans that made a provider call, not on the parent agent or tool spans that wrap them. Then group by run ID to see which tasks are expensive. Optimizing starts from that breakdown: look for loops, repeated retries and oversized prompts before changing models.
An offline aggregation sketch: sum the chosen layer, flag overlap, report unknowns
You can check all of this offline against exported span data before trusting any dashboard. This is generic Python over a list of span dicts, not a telemetry.dev API. Field names are placeholders for whatever your exporter writes.
def aggregate(spans, layer="gateway.attempt"):
    chosen = [s for s in spans if s["name"] == layer]
    other = [s for s in spans if s.get("usage") and s["name"] != layer
             and not s.get("is_rollup")]

    total_in = total_out = 0
    unknown = []
    seen = set()
    for s in chosen:
        u = s.get("usage")
        if u is None:
            unknown.append(s["span_id"])
            continue
        key = s.get("provider_response_id") or s["span_id"]
        if key in seen:
            continue  # same provider response reported twice
        seen.add(key)
        total_in += u["input"]
        total_out += u["output"]

    overlap = [s["span_id"] for s in other
               if s.get("provider_response_id") in seen]
    return {"input": total_in, "output": total_out,
            "unknown_attempts": len(unknown),
            "overlapping_other_layer": len(overlap)}
Three things happen here. It sums only the chosen layer, so rollups and the other layer never enter the total. It dedupes on provider response ID when present, which is attempt-level evidence rather than a trace ID. And it reports two diagnostics: unknown attempts, and spans from the other layer that overlap the chosen one. A high overlap count is not an error. It confirms that both layers are reporting and that you were right to pick only one.
Run it on one day of exported data and compare the result to that day's provider usage page. If the gap is smaller than your naive sum's gap, the rules are working.
What are good practices for LLM token tracking?
Track tokens as reported by the provider response, per attempt, with the model name attached. Sum one layer only, keep retries and fallbacks as separate entries, and store missing usage as unknown instead of zero. Compare your monthly total with the invoice and investigate any gap. Cost computed from tokens depends on reported usage and a pricing match for the model, so treat it as an estimate unless the provider states the amount.
Sending both layers to telemetry.dev over OTLP/HTTP, and what to verify against your invoice
telemetry.dev is LLM observability built on OpenTelemetry that traces model calls, tool steps and retrievals and tracks cost, latency, tokens and errors for small teams. It has first-party TypeScript and Python SDKs, plus a LiteLLM integration in Python, so the gateway layer can report alongside your app. The LiteLLM tracing guide covers getting the two layers into one trace.
Sending both layers is useful because you can compare them. Your own aggregation decides which one counts. Treat any cost figure as an estimate and the provider invoice as the final word.
Before you trust a total, verify four things against the invoice for one billing day:
Attempt count. Does your count of billable attempts match the provider's request count for that model?
Token totals per model. Input and output separately, since they price differently.
Unknown bucket. Is it small and explained, or large and growing?
Overlap count. Is the other layer overlapping the chosen one, and by roughly the amount you expect?
If those four line up, your accounting layer is sound. If the attempt count is off, look at gateway retries first.
Can I track GPU cost as well as token cost?
If you run your own models, token and latency data on each call still helps estimate cost per request. GPU spend itself usually comes from your cloud bill, so reconcile it separately from API token spend and keep the two out of one total.
What is AI cost observability?
AI cost observability is the practice of recording token usage, model, latency and price for every LLM call, then attributing spend to a feature, user or agent run. It differs from general AI observability, which also covers errors and quality, and from cost visibility, which is just a dashboard total. For gateway setups, the hard part is counting each upstream request once, so span-summed totals can be checked against the provider invoice.
Can observability telemetry storage add to cost overruns?
Yes, because every span, log record and metric point is stored and usually billed or limited by volume. Sending both gateway and app spans for the same request roughly doubles that volume. Cap what you capture, sample low-value traces and keep prompt bodies off if you don't need them. At telemetry.dev, the Free plan allows 30,000 units a month.
Pick one layer this week and reconcile one day of spend
Double counting is an accounting choice you failed to make, not a tracing bug. Choose one layer, count billable attempts, exclude rollups, and keep unknowns visible. Then export one day of spans, run the aggregation above, and compare it to that day's provider usage. To see both layers side by side, point your app and gateway OTLP/HTTP exporters at a free telemetry.dev workspace (30k units, 14-day retention) and run the check on real traces.
Share this article