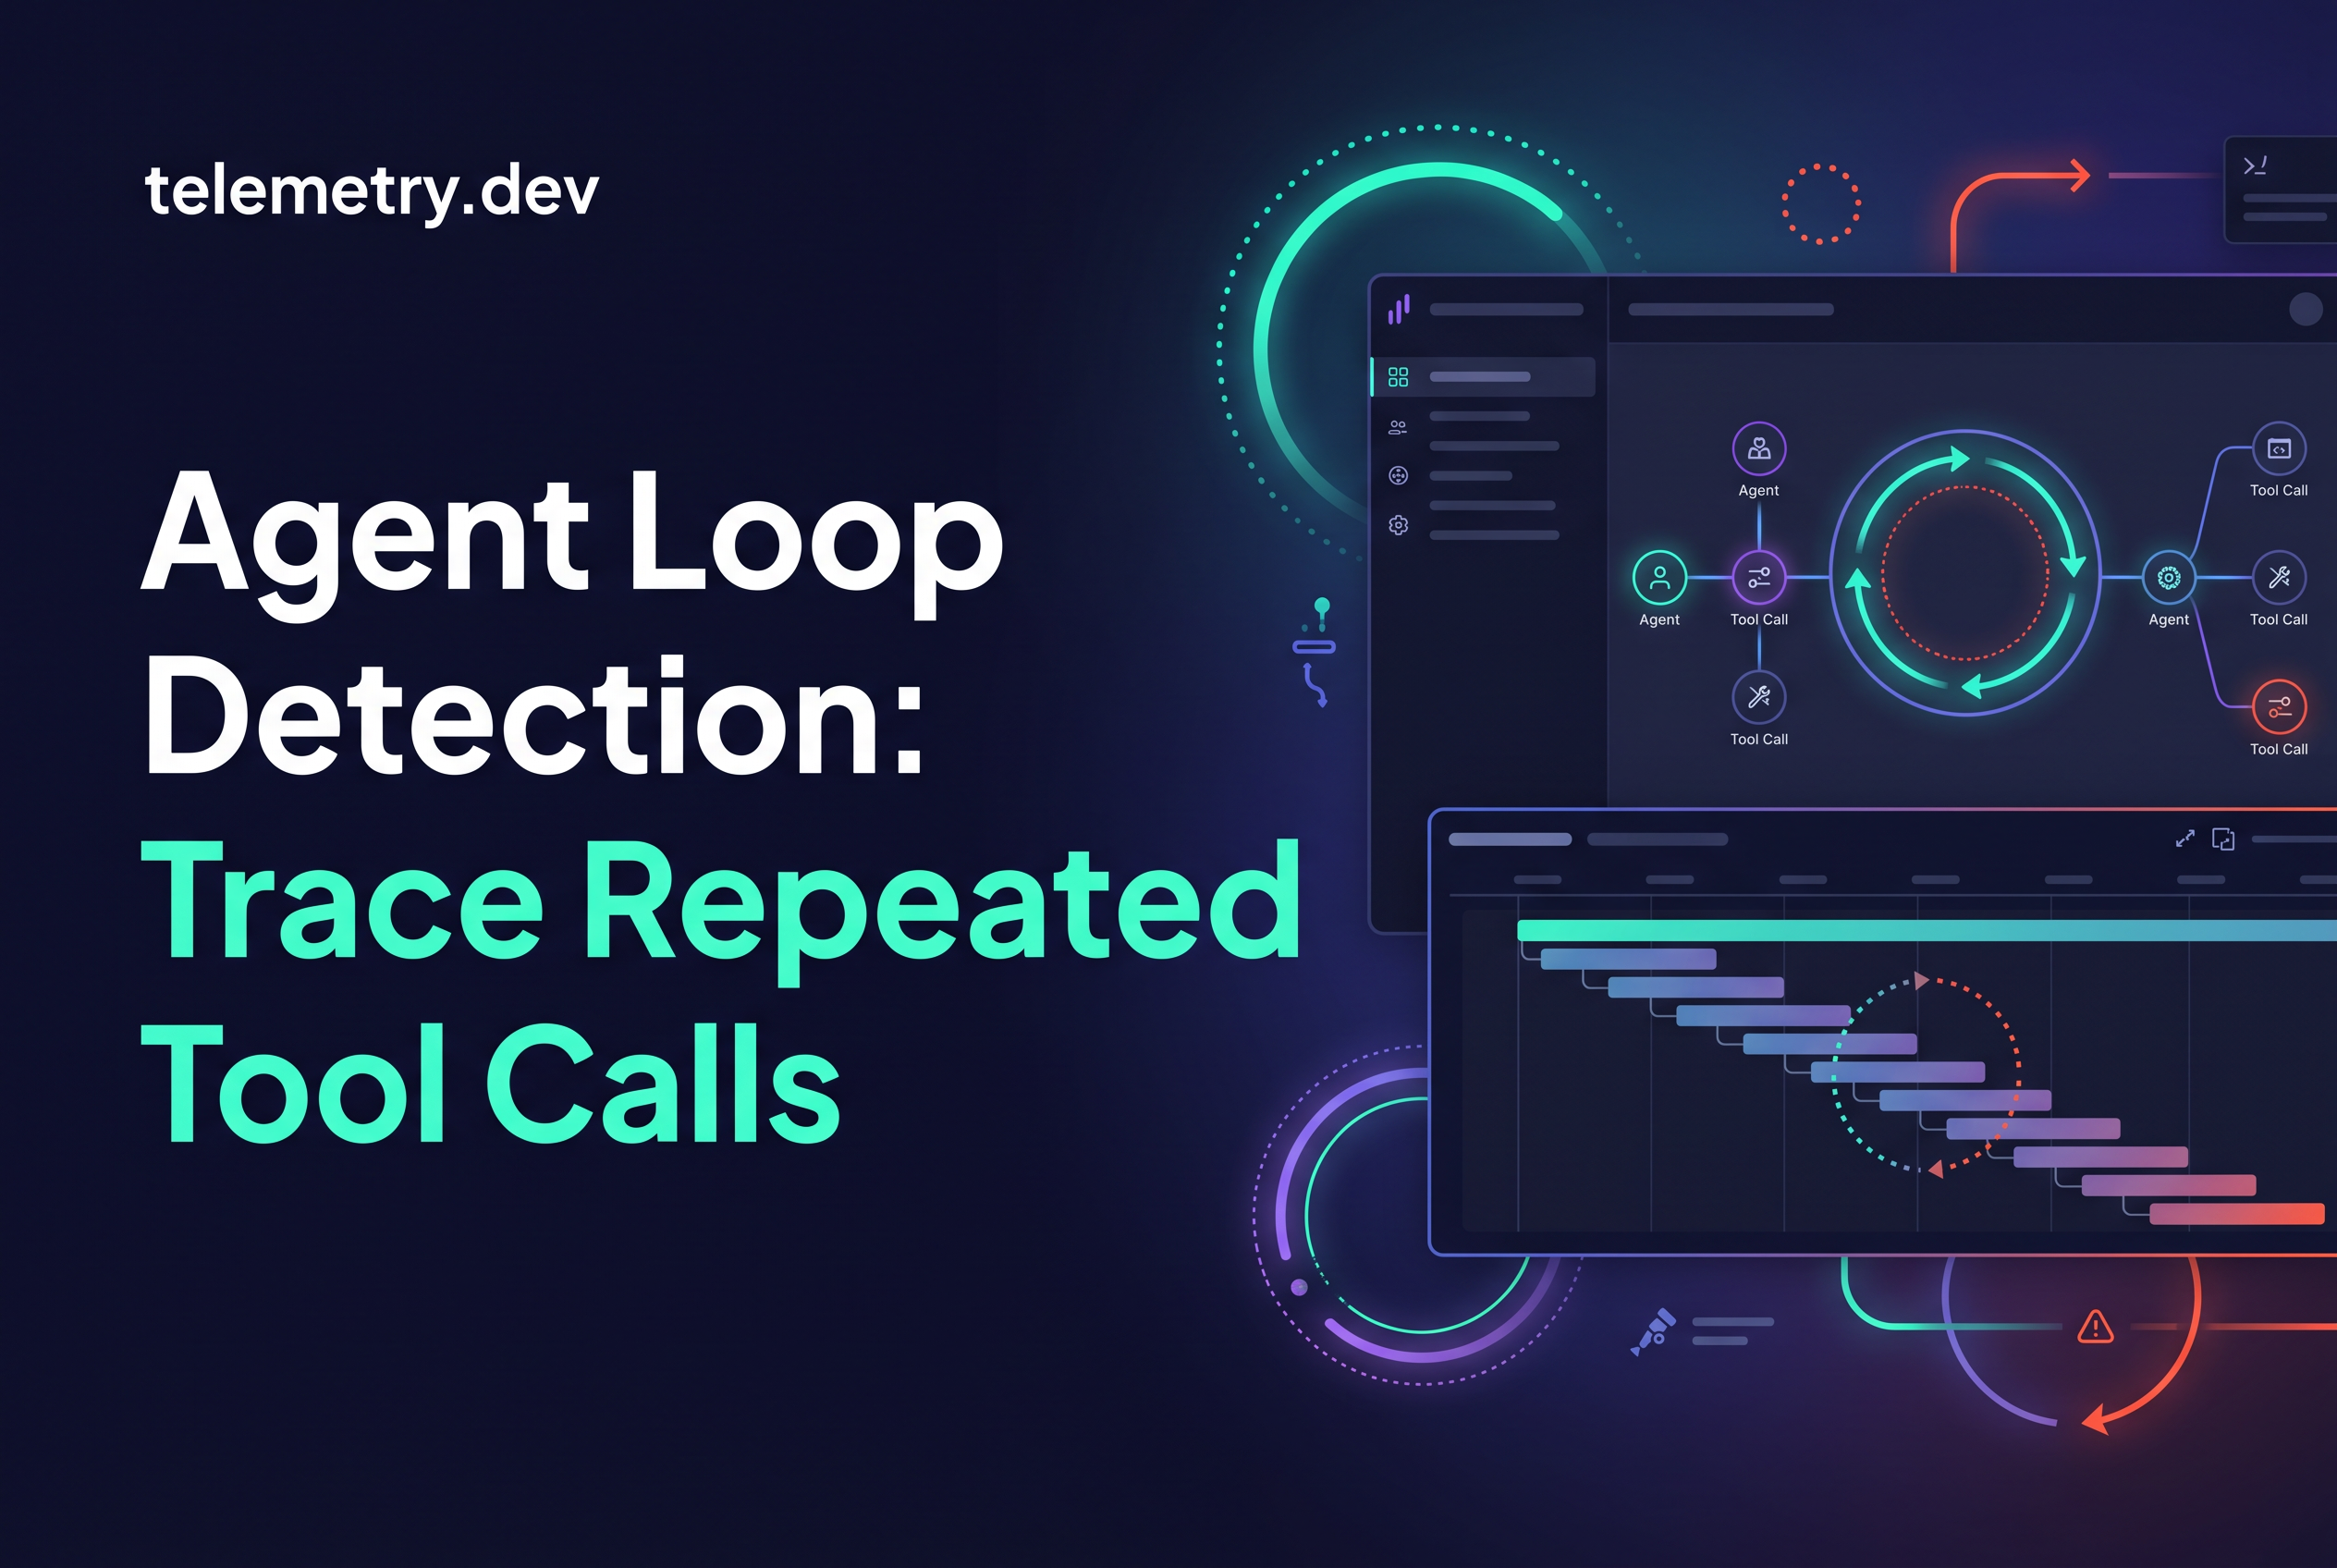
Agent loop detection comes down to one question you can answer from a trace: did the same tool get called again with the same arguments and return the same result, with nothing else changing between calls? If yes, the agent is stuck. If the arguments, results or state moved, it is working, even when the tool name repeats forty times.
The expensive failure is quiet. A run keeps calling search_docs or get_order_status, each call looks healthy, and the token bill climbs until a step cap or a timeout ends it. Counting calls alone misleads you, because a legitimate polling loop and a stuck loop look identical on a dashboard that only shows totals.
This guide is narrow on purpose. It shows how to emit one span per tool call, what to compare across repeated spans, and how to separate retries, polling and real loops. The stop conditions are code you write in your app. telemetry.dev is LLM observability built on OpenTelemetry, so it gives you the traces to inspect. It does not detect loops or alert on them for you.
What an agent loop looks like in a trace (and what it is not)
A real agent loop is a run where consecutive model steps trigger the same tool call with equivalent arguments and receive equivalent results, so the agent's state never advances. In a trace it reads as a repeating pattern under one parent run: model call, tool span, model call, tool span, with the tool spans nearly identical.
Three things look like loops and are not:
Retries. The same call repeats because the previous one failed, usually with an error status, and the failure reason is a transient one.
Polling. The same call repeats on purpose because the result is expected to change, such as a job status moving from
queuedtorunningtodone.Legitimate repeats. The same tool runs many times with different arguments, like fetching ten different user records.
A loop is the case where none of those explanations hold. Same tool, same arguments, same result, no error, and the model keeps asking anyway. That combination is the whole definition. Hold onto it, because every check below tests it.
Instrument tool calls so repeats are visible: one execute_tool span per call
You can only compare repeated calls if each call is its own span, so emit exactly one execute_tool span per tool invocation. The OpenTelemetry GenAI semantic conventions recommend an INTERNAL span named execute_tool {gen_ai.tool.name} and recommend gen_ai.operation.name be execute_tool, though these are recommendations rather than absolute requirements.
The attributes that matter for loop work:
gen_ai.tool.nameis required, and it is your grouping key.gen_ai.tool.call.idis set when the model or provider supplies an ID. It lets you tie a span back to the model's request.gen_ai.tool.call.argumentsandgen_ai.tool.call.resultare opt-in. Turn them on. Without them you cannot tell a repeat from a progression.
If you use the Vercel AI SDK, LangGraph, Pydantic AI or CrewAI, check which of these your instrumentation actually emits before trusting a comparison. Missing argument or result attributes are the most common reason a loop is invisible. Spans exported over OTLP/HTTP, through telemetry.dev's TypeScript or Python SDKs or a Collector, carry whatever you attach. For prompt and payload capture settings, see OpenTelemetry GenAI Prompt Capture: Inspect Before Export, and confirm spans arrive intact with OpenTelemetry LLM Observability: Verify Exported Spans.
Keep span parentage clean too. Every tool span should sit under the model step that requested it, and every step under one run span. If async work breaks that tree, see LLM Tracing: Fix Async Parent and Child Span Links.
What are the best practices for AI agent observability?
Emit one span per tool call, record arguments and results where it is safe to, and keep a run identifier so every step groups into one trace. Track tokens, cost and latency on each model span, and alert on call counts per run rather than only on errors. Add step caps in application code as a hard stop. Keep capture settings deliberate, since logging prompts and tool payloads can include sensitive data.
Retry, poll or loop? Telling expected repeats from stuck ones
Classify a repeat by what changed between spans, not by how many there are. Walk each repeated tool span through three questions in order.
Did the previous call fail? If the earlier span has an error status and the next call follows it, you are looking at a retry. Retries are expected up to a bound. The question is whether the failures keep recurring unchanged. That is a separate problem covered in Agent Telemetry: Trace Retries and Tool Failures, so only note it here.
Is the result supposed to change? If the tool reads a status that moves over time, repeated calls are polling. A healthy poll shows the result field advancing, or at least a bounded wait between calls. A poll that returns running fifty times with no change in elapsed time or progress is stuck, not polling. For jobs that outlive a request, trace the queue boundary as described in Generative AI Monitoring: Trace Queued Agent Jobs.
Are the arguments different each time? If so, it is fan-out, not a loop. Ten calls to get_user with ten IDs is a batch.
What survives all three questions is your loop: success status, identical arguments, identical result, and no state in the run that explains why the model would ask again. Be strict here. Calling every repeat a loop floods you with false alarms, and that trains you to ignore the real ones.
Spot repeated unchanged state: compare arguments, results and call counts
Detect a loop by fingerprinting each tool span and counting how often the same fingerprint recurs within one run. The fingerprint is the tool name plus a normalized form of gen_ai.tool.call.arguments. Add a hash of gen_ai.tool.call.result to detect unchanged state.
There are three signals, in rising order of confidence:
Same tool, high call count. Weak on its own. A count of 15
search_docscalls could be a research task.Same tool and same arguments, repeated. Stronger. Identical input to a deterministic tool should rarely need asking twice.
Same arguments and same result hash, repeated with no error. Strongest. The agent asked the same question and got the same answer, repeatedly.
Normalize before you compare. Sort JSON keys, trim whitespace and drop volatile fields like timestamps or request IDs, or two identical calls will hash differently and hide the loop. Near-duplicates matter too. An agent that rewords a search query slightly each turn and gets the same top results is looping semantically. Comparing the result hash catches that when comparing arguments would not.
Watch for the slow variant, a cycle between two tools. The agent calls read_file, then edit_file, then read_file again, reverting its own change. Per-tool counts look modest, but the sequence of fingerprints repeats. Look at the ordered list of spans under the run, not just per-tool totals.
Inspect a looping run in telemetry.dev: find the repeated step and its cost
Open the run's trace and read the tool spans in order. In telemetry.dev, traces cover model calls, tool steps and retrievals with cost, latency, tokens and errors, so a looping run shows up as a long column of near-identical steps under one parent.
A practical inspection routine:
Find the repeated step. Scan the span list for the same
execute_toolname recurring. Open two or three of them and compare captured arguments and results side by side.Check for any change. If results differ, note how: a growing offset, a new field, a different status. Progress means polling or pagination, not a loop.
Read the model spans between them. The model step before each repeat tells you why it asked again. A prompt that keeps receiving the same unhelpful tool output and no new instruction is the usual cause.
Price the loop. Sum the token and cost figures on the repeated model and tool steps to see what the stuck stretch cost. Cost comes from reported token usage matched to model pricing, so treat it as a close estimate, not a billing reconciliation. For connecting spend to a run, see AI Cost Observability: Trace Spend to Agent Runs.
This is inspection, not automation. telemetry.dev shows you the repeated spans and what they cost. Deciding that a pattern is a loop, and doing something about it, is logic in your application.
Which frameworks and providers can send agent traces to telemetry.dev?
telemetry.dev has integrations for OpenAI, Anthropic, Google Gemini, AWS Bedrock, OpenRouter, LiteLLM, the Vercel AI SDK and TanStack AI, plus setup guides for LangChain/LangGraph, Pydantic AI, CrewAI and Claude Code. Any OTLP/HTTP exporter also works, so existing OpenTelemetry instrumentation can send data without lock-in. An integration does not guarantee every framework event or attribute is captured, so check a real trace for the spans you need.
Add your own guardrails: step caps and stop conditions in application code
A loop guard is application code that ends a run, and your framework probably already ships the cheapest one: a step cap. Use it first, then add a fingerprint check on top.
In the Vercel AI SDK, stopWhen caps the tool loop and ends when any listed condition is met. For example:
import { ToolLoopAgent, stepCountIs, hasToolCall } from 'ai';

const agent = new ToolLoopAgent({
  model,
  tools,
  stopWhen: [stepCountIs(10), hasToolCall('finalAnswer')],
});
Match the helper name to your installed version, since AI SDK 7 renames stepCountIs to isStepCount. In LangGraph, a run that exceeds its recursion limit raises GraphRecursionError, set through the recursion_limit config key. That error usually means a missing exit condition in your routing, so fix the conditional edge before raising the limit.
A step cap is blunt. It stops a legitimate long task and a loop alike. Layer a smarter check in your own loop code:
Keep a per-run counter keyed on the tool name plus argument and result hashes.
When one key reaches a threshold you choose, such as three identical successes, stop calling tools and return a final answer or hand off to a person.
Tag the run span with an attribute like
agent.loop_guard.trippedso you can find guarded runs later in your traces.
The threshold and the stop behavior are yours to tune, and nothing here is automatic. Start low on high-cost tools and loosen from the data you see in real runs.
Can monitoring catch risky runtime behavior in an agent?
Monitoring shows what an agent did after the fact, such as which tools it called, how often and with what arguments, but it does not block anything on its own. For runtime safety, enforce limits in your code: step caps, tool allowlists and stop conditions. Use traces to review unusual tool use, repeated calls and cost spikes, then turn those findings into rules. Treat captured payloads as sensitive, since they can include user data.
Where this fits in broader agent monitoring
Loop detection is one slice of AI agent monitoring, which means tracing what an agent does at runtime, tool calls and model steps included, then measuring latency, cost, tokens and errors against it. The metrics that tie to loops are steps per run, tool calls per run and cost per run, each tracked as a distribution, not an average. A rising p95 on steps per run is an early warning that some runs are spinning.
For the run-level view, see AI Agent Monitoring: Measure Run Success and Latency. On how to interpret agent behavior generally: read the trace as a sequence of decisions, and ask at every step what new information the agent had. If the answer is none, you have found the problem.
What does AI agent monitoring look like in 2026?
Agent monitoring in 2026 means tracing every model call, tool step and retrieval, then watching cost, latency, tokens and errors per run. The shift is toward OpenTelemetry as the common format, so traces from any framework land in one place. For loops specifically, the practical signal is repeated tool calls with unchanged arguments and results inside a single run. telemetry.dev covers this with first-party TypeScript and Python SDKs and standard OTLP/HTTP ingestion.
What should I check for governance and compliance in agent monitoring?
Decide what you capture before you ship. Prompts, tool arguments and results can contain personal or confidential data, so limit capture and redact where you can. Redaction is not a guarantee that all sensitive data is caught. Also check where telemetry is stored.
How do I compare production agent monitoring tools?
Compare on what you actually need: trace detail for tool calls, cost and token tracking, framework support, hosting model, retention and pricing. Check whether pricing is per seat or per workspace, and whether the tool needs self-hosting. telemetry.dev is OpenTelemetry-based, hosted, and priced per workspace on usage, from a free plan up to $50 a month for Team. Side-by-side pages are at telemetry.dev/alternatives.
Fingerprint your tool spans, then cap the run
A loop is not a high call count. It is the same tool, the same arguments and the same result, repeated without an error and without any state moving forward. Emit one execute_tool span per call with arguments and results captured, fingerprint them, and write a stop condition in your own code. Next step: send a looping run to telemetry.dev with the free plan (30k units), open the trace, and compare the repeated tool spans side by side to see what your agent kept asking.
Share this article